
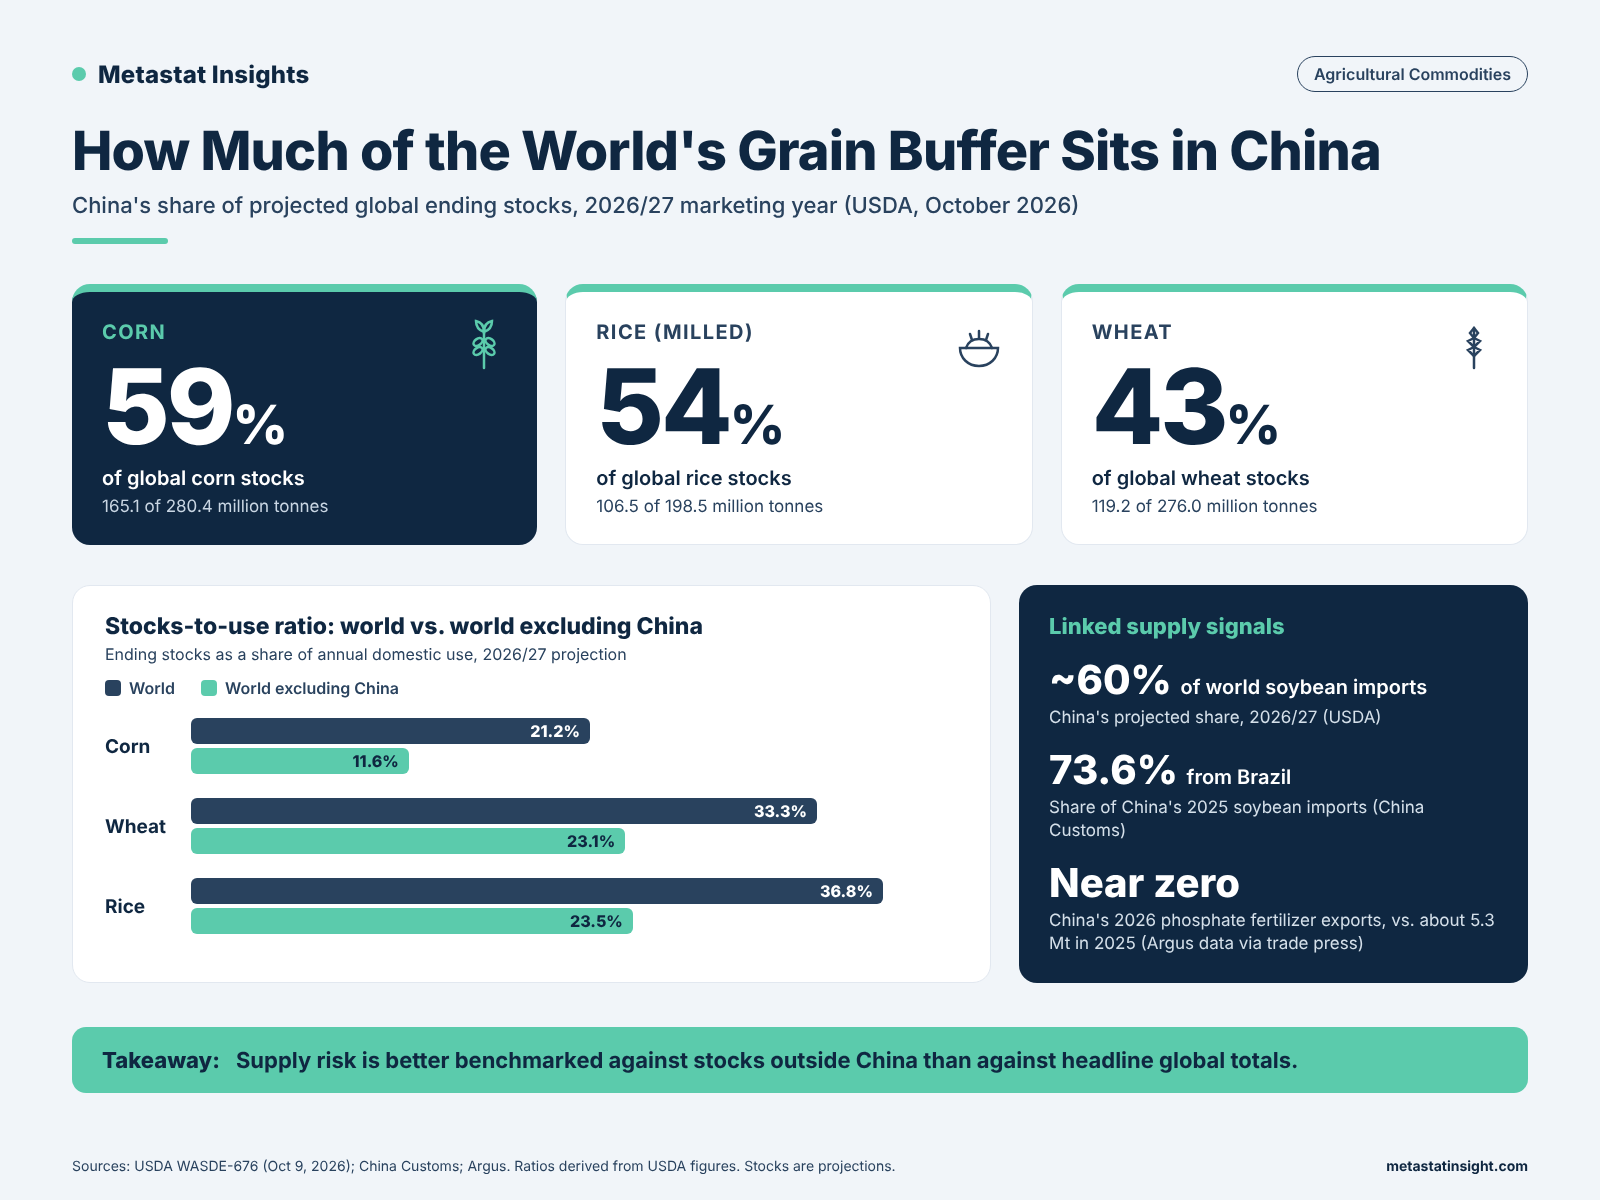
China is projected to hold about 59% of global corn stocks, 54% of rice and 43% of wheat. This analysis explains why headline reserves overstate tradeable supply and what that means for food buyers, feed companies, fertilizer users and import-dependent economies.
When analysts cite global grain stocks as the world’s cushion against drought, conflict or a failed harvest, they are describing a cushion that is unevenly placed. In its October 2026 World Agricultural Supply and Demand Estimates, the US Department of Agriculture projects that China will end the 2026/27 marketing year holding about 165 million tonnes of corn, 106.5 million tonnes of milled rice and 119 million tonnes of wheat.
Set against USDA’s world totals, that is roughly 59% of global corn stocks, 54% of rice stocks and 43% of wheat stocks. The pattern is not new. What has changed in 2026 is the setting: fertilizer export controls, a prolonged dispute over soybean trade and disrupted Gulf shipping have pulled food and farm inputs into the same supply-security discussion that already covers energy and semiconductors.
For buyers, the practical issue is access. The relevant number is how much grain can reach the rest of the market when supply tightens, and that number is smaller than the headline suggests.
 How Concentrated Are China Grain Stocks in 2026?
China’s stockholding rests on explicit policy. Its Food Security Law, in force since June 2024, commits the state to absolute security in staple cereals and basic self-sufficiency in grain more broadly. The law also anchors a farmland “red line” of 1.8 billion mu, about 120 million hectares, that restricts conversion of cultivated land to other uses. The target covers staples such as rice and wheat; it does not imply self-sufficiency across all foods, as the soybean trade makes clear.
Two qualifications matter. First, China does not publish detailed reserve volumes, so USDA’s figures are estimates and have been revised substantially in the past. Second, stockholding and export restraint are not unique to one government. USDA projects India will hold about 57 million tonnes of rice at the end of 2026/27, India restricted rice exports in 2023, and Russia continues to apply fertilizer export quotas. Many states treat staple supply as a strategic asset.
There is also a credible counterargument to the view that China’s reserves simply tighten world markets. Large domestic stocks reduce the likelihood that China becomes an aggressive buyer during a shock, which can ease pressure on prices elsewhere. Both effects can hold at once, depending on the commodity and the season.
Why Headline Stocks-to-Use Ratios Overstate Tradeable Supply
The stocks-to-use ratio, ending stocks as a share of annual consumption, is one of the most watched indicators in grain markets. Calculated from the same USDA projections, the gap between the global figure and the figure excluding China is wide:
- Corn: 21.2% globally, but 11.6% excluding China
- Wheat: 33.3% globally, but 23.1% excluding China
- Rice: 36.8% globally, but 23.5% excluding China
USDA itself publishes “world less China” balance sheets for this reason. For an importer in North Africa, the Middle East or Southeast Asia, the lower ratio is the more realistic measure of the buffer available through trade. It implies greater price sensitivity to weather in the main exporting regions, including the US, Brazil, Argentina, the Black Sea and Australia, than the headline total suggests.
For strategy teams, this changes how risk is mapped across the value chain. Trading houses, storage operators and processors sit at the points where accessible supply is priced. The Global Agribusiness Market report covers that structure across input supply, commodity trading, post-harvest storage and processing.
Pork, Feed and the Soybean Import Chain
USDA projections indicate that China accounts for roughly half of global pork production and consumption, which makes its hog sector the main transmission channel between Chinese demand and world feed markets.
The last major disruption shows the scale involved. After African swine fever reached China in 2018, a USDA Economic Research Service study estimated the country lost 27.9 million tonnes of pork output over a 30-month cycle of decline and recovery. The swine inventory fell to about 307 million head at its low point in late 2019, and pork prices more than doubled.
China maintains a central frozen pork reserve, but it functions mainly as a price-stabilization tool. Authorities buy into the reserve when the ratio of hog prices to grain prices falls below set warning levels and release supply when prices spike. In spring 2026, with that ratio below 5:1 and producers losing money, officials announced additional batches of frozen pork purchases to support prices.
A protein system built on imported soybeans
The hog herd’s feed depends heavily on imported soybeans. China imported a record 111.8 million tonnes in 2025, according to its customs data, and USDA projects 2026/27 imports of 115 million tonnes, about 60% of world soybean imports.
Sourcing has shifted sharply. Brazil supplied 73.6% of China’s 2025 soybean imports, according to customs figures, while the US share fell to about 15% from 21% a year earlier, based on figures from commodity consultancy Hedgepoint reported by trade media. During the 2025 tariff dispute, China recorded no US soybean arrivals in several months, including the final three months of the year. A mid-2026 agreement removed a 10% retaliatory tariff on US soybeans, and Chinese buyers have since taken a large share of new-crop US export sales.
The commercial point is that sourcing is a policy variable as much as a price variable. Brazil gains volume but also deepens its exposure to a single buyer, while its soybean output depends on imported crop nutrients. The Brazil Fertilizers Market report examines that link across nutrient systems, including phosphate, and crop types such as oilseeds.
Fertilizer Export Controls Move Food Security Upstream
In December 2025, China’s National Development and Reform Commission announced a suspension of phosphate fertilizer exports through August 2026. Broader export curbs followed in March 2026, after disruption around the Strait of Hormuz tightened global fertilizer and energy supply. Argus data cited by trade outlets show China’s phosphate fertilizer exports falling from about 5.3 million tonnes in 2025 to almost nothing in 2026.
Urea is a different story. Argus expects China to export around 6 to 7 million tonnes of urea in 2026, volumes that have helped temper nitrogen prices. The selective approach suggests Beijing is managing domestic availability product by product rather than withdrawing from fertilizer trade altogether.
For import-dependent farm economies, the effect is higher phosphate costs at a time when a sulfur shortage is already constraining production in other regions. Procurement teams should treat fertilizer export policy as a recurring calendar risk. The Fertilizer Market report provides segment context for phosphorus and other nutrient categories, along with raw material price pressures.
India’s Exposure Sits in Edible Oils and Gas-Based Urea
India offers a useful contrast. On staple cereals it is well buffered: USDA projects Indian ending stocks of about 57 million tonnes of rice and 29.5 million tonnes of wheat for 2026/27. Its vulnerabilities lie elsewhere in the food system.
Edible oil is the clearest example. According to a Government of India briefing on the National Mission on Edible Oils, import dependence fell from 63.2% in 2015-16 to 56.25% in 2023-24. That is an improvement, but more than half of domestic demand is still met from abroad, mainly palm, soybean and sunflower oil.
Nitrogen fertilizer is the second exposure. India’s urea plants run on natural gas, much of it imported as LNG. When Gulf supply was disrupted in March 2026, the government placed fertilizer plants on a priority list for gas allocation. For India, food security risk now sits less in cereals and more in oils and energy-linked inputs.
What Procurement and Strategy Teams Should Track
The broader lesson is that food security policy increasingly shapes trade flows, and it does so through stocks, sourcing and inputs at the same time. Four indicators deserve regular attention:
- Stocks-to-use excluding China, rather than headline global ratios, as the benchmark for accessible supply
- Chinese state purchasing and reserve operations, including soybean buying programs and pork reserve activity, as demand signals
- Fertilizer export policy calendars in China, Russia and other major suppliers, alongside import tenders in India and Brazil
- Chokepoint exposure, particularly the link between Gulf shipping, LNG and nitrogen fertilizer output
None of these signals points to an imminent global shortage. Together they describe a market where reported abundance and practical availability can diverge, and where the gap widens during disruptions. Companies that plan around access rather than aggregate supply will be better placed when the next shock arrives. For a structured view of how these pressures flow through inputs, trading and processing, the Global Agribusiness Market report is a useful starting point.
Tags
About the Author

LEAD ANALYST
Utkarsh Khirodkar is a Lead Market Research Analyst at MetaStat Insight, specializing in market intelligence, technology sector assessments, and competitive strategy.