
LEAD ANALYST
Utkarsh Khirodkar is a Lead Market Research Analyst at MetaStat Insight, specializing in market intelligence, technology sector assessments, and competitive strategy.

Global Non-Dairy Toppings Market Size, Share, By Product Form (Liquid Whipping Toppings, Powdered Whipping Topping Mixes and Pre-Whipped Toppings), By Application (Cakes and Pastries, Desserts and Mousses, Ice Cream and Frozen Desserts, Beverages and Others (Fruit Preparations, Breakfast Dishes)), By Source (Coconut-Based, Almond-Based, Soy-Based, Oat-Based and Others), By Distribution Channel (Supermarkets and Hypermarkets, Convenience Stores, Online Retail and Foodservice), Industry Analysis, Growth, Trends, and Forecast, 2026-2033
Report ID
MSI-5424
Published
October, 2026
Pages
252 Pages
Format
Historical
Base year
Forecast
Forecast period
Report Details
Market Valuation: Valued at $1,338.3 Million in 2025, projected to reach $2,552.2 Million by 2033 at a 8.4% CAGR.
Dominant Segment: Liquid whipping toppings lead the market, projected to reach USD 1,552.5 million by 2033, driven by their versatility and ability to closely mimic traditional whipped cream in bakery, dessert, and beverage applications.
Geographic Lead: North America is the leading region, holding 30.3% of the market in 2025, with the US leading in 2026 due to early adoption of plant-based foods and a strong presence of food innovation companies.
Fastest-Growing Source: Oat-based toppings are the fastest-growing source segment, with a projected CAGR of 13.6% through 2033, reflecting rising demand for allergen-friendly and sustainable alternatives.
Fastest-Growing Application: Beverages represent the fastest-growing application segment, forecast to expand at a 10.3% CAGR as specialty drinks and café chains drive innovation in plant-based topping options.
What's Inside: The report provides detailed segmentation by product form, application, source, and distribution channel, along with regional analysis, competitive landscape, and forecasts from 2026 to 2033.
Choose Your License
Global Non-Dairy Toppings Market
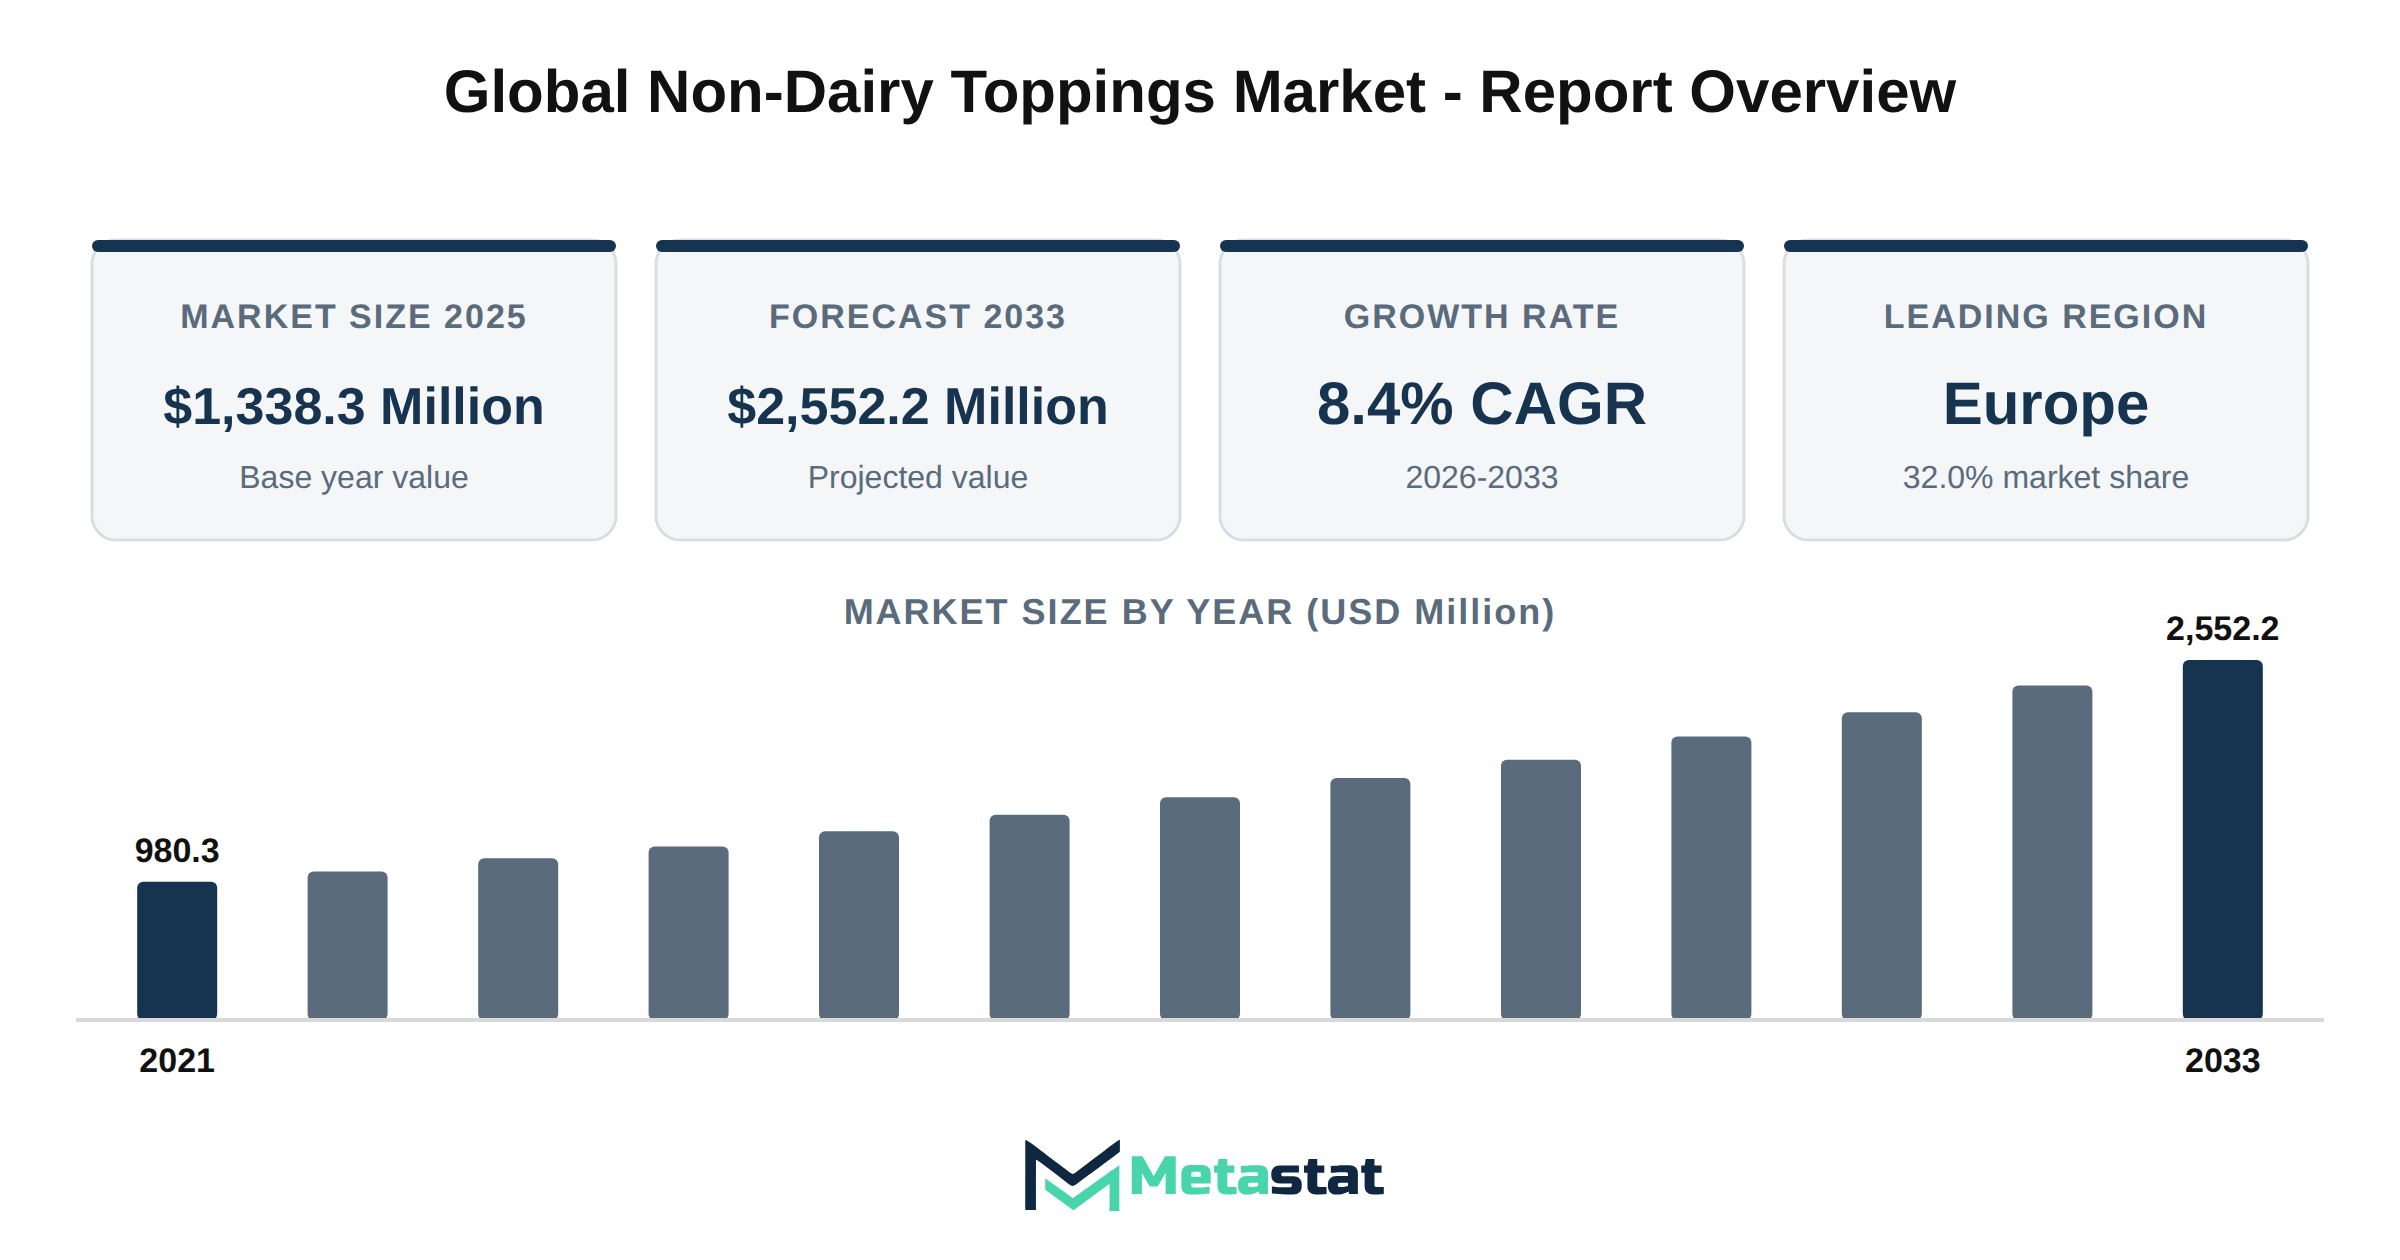
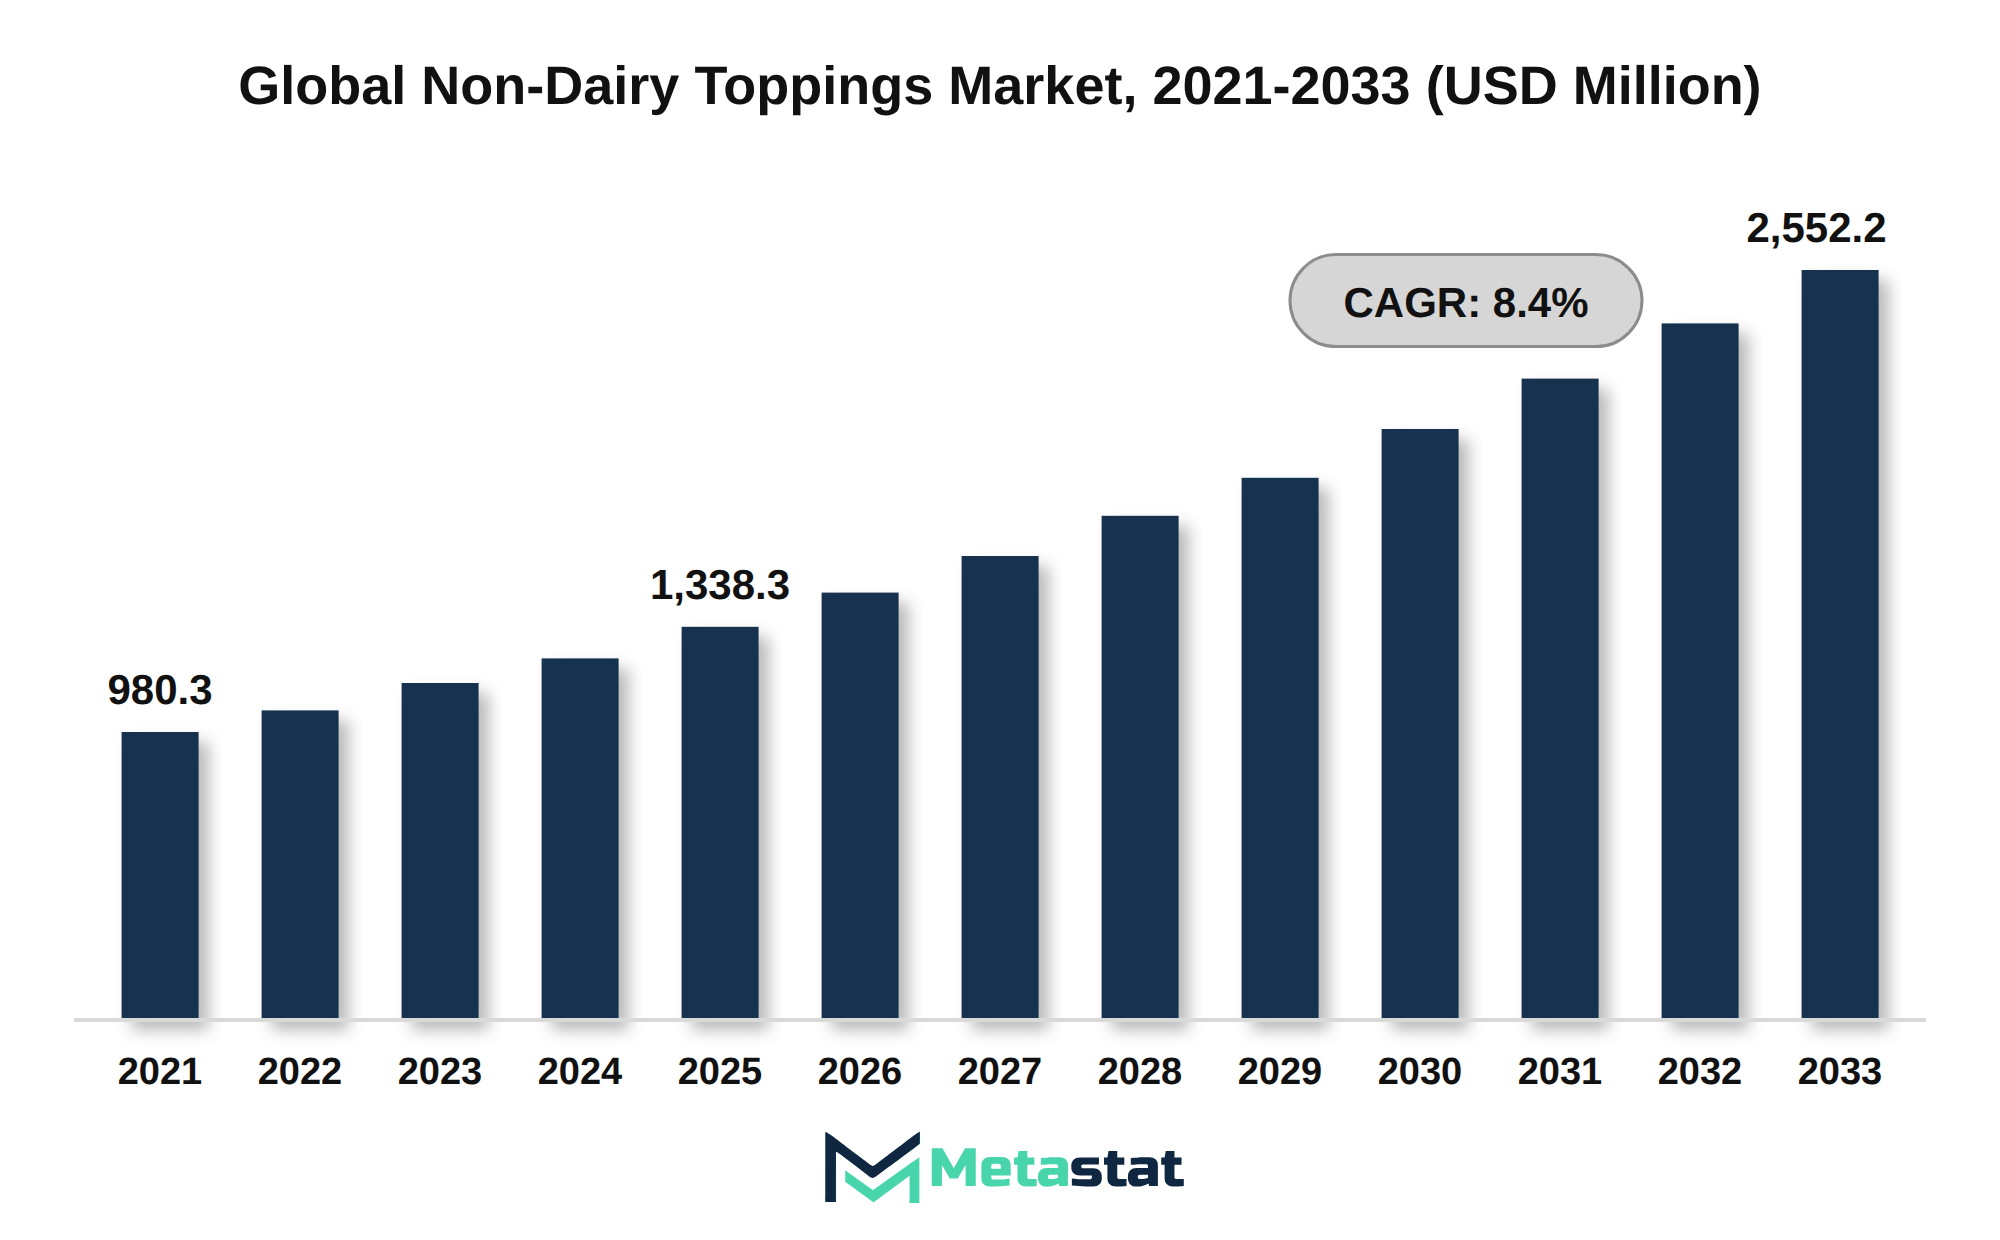
The global Non-Dairy Toppings market was valued at USD 1,338.3 million in 2025 and is projected to reach USD 2,552.2 million by 2033, growing at a CAGR of 8.4% over the forecast period.
The Non-Dairy Toppings market covers plant-based alternatives designed for use on cakes, pastries, desserts, beverages, and frozen treats, replacing traditional dairy toppings for consumers seeking vegan, lactose-free, or allergen-friendly options. Buyers include commercial bakeries, foodservice operators, and health-conscious home consumers, all seeking toppings that deliver taste and texture without animal-based ingredients. Purchases increase on changing dietary habits, greater awareness of plant-based nutrition, and the growing prevalence of lactose intolerance and dairy allergies.
Liquid whipping toppings represent the segment with the highest value. Their versatility and close resemblance to conventional whipped cream in both application and sensory experience support this position. These products work in bakery, dessert, and beverage preparations, making them the preferred choice for professionals and households alike. North America holds 30.3% of the market in 2025. The US leads in 2026, reflecting early adoption of plant-based foods and a robust presence of food innovation companies.
Rising consumer interest in healthier and more sustainable food choices drives growth for the Non-Dairy Toppings market. Consumers seek options that align with wellness trends and ethical sourcing, which encourages manufacturers to expand their portfolios with cleaner labels and natural ingredients. This focus on health and sustainability has increased product development activity and widened the appeal of non-dairy toppings to a broader audience.
The Non-Dairy Toppings market covers a range of plant-based products used by bakeries, foodservice operators, and households seeking alternatives to dairy toppings for both dietary and sustainability reasons. Buyers spend on these products to address lactose intolerance, vegan preferences, and growing awareness of environmental impact related to animal-derived foods. The market encompasses liquid whipping toppings, powdered mixes, and pre-whipped options, each catering to different preparation styles and consumer preferences. Leading players offer coconut-based, almond-based, soy-based, and oat-based formulations to serve varied taste and texture requirements across cakes, pastries, desserts, and beverages.
Liquid whipping toppings account for the largest revenue within product form, with USD 1,552.5 million projected by 2033. These products see widespread use in both commercial and home baking. Cakes and pastries remain the dominant application segment. Bakeries and patisseries show a strong preference for non-dairy alternatives that deliver comparable performance to dairy-based toppings. Similar plant-based substitution trends are shaping production across the broader confectionery market, where clean-label and dairy-free formulations are gaining market share. North America holds 30.3% of the market in 2025. The US leads in 2026. This regional strength reflects a high concentration of specialty bakeries, advanced retail infrastructure, and a consumer base that actively seeks plant-based and allergen-free options.
Growth in the Non-Dairy Toppings market is primarily driven by expanding consumer adoption of plant-based diets, which influences both brand portfolios and retail shelf space. Foodservice and retail sectors respond to this shift by increasing their offerings of non-dairy toppings, supporting higher product visibility and accessibility. Product innovation targeting taste, texture, and clean-label positioning encourages repeat purchases among both institutional and household buyers.
Reformulation strategies in the Non-Dairy Toppings market increasingly focus on achieving milk-free and clean-label claims, reflecting heightened consumer scrutiny of ingredient lists. Manufacturers are shifting away from artificial stabilizers and emulsifiers, instead favoring plant-derived thickeners and natural flavor systems that appeal to label-conscious buyers. This trend is evident in the growing share of coconut-based and almond-based toppings. These products provide versatile bases in both liquid and powdered forms. Coconut-based toppings are projected to increase from USD 420.3 million in 2026 to USD 757.2 million by 2033, supported by consumer preference for recognizable, allergen-free ingredients.
Foodservice chains and bakery producers are among the first to demand these reformulated products, driven by rising consumer expectations for transparency and dietary inclusivity. Reformulation initiatives often prioritize allergen avoidance and short ingredient lists, which align with clean-label positioning and milk-free certifications.Product launches highlight claims including “free from dairy, soy, and gluten,” leveraging alternative bases like oats and legumes. Reformulation not only supports premium pricing but expands the potential audience for both retail and foodservice channels. These non-dairy formulation strategies mirror developments in the RTD sports nutrition market, where plant-derived proteins and allergen-friendly bases increasingly replace traditional dairy whey. Accelerated product innovation cycles are evident, with suppliers investing in new processing technologies and ingredient partnerships to maintain relevance and capture growth opportunities in health-driven segments.
Bakery chains and commercial patisseries are prioritizing whipping yield and heat stability when selecting suppliers in the Non-Dairy Toppings market. Purchasers assess not only taste and mouthfeel but measure how much finished whipped topping is delivered per kilogram of mix and how well the product withstands high bakery kitchen temperatures. This focus is strongest among buyers in the cakes and pastries application, which accounted for USD 671 million in 2026 within the market’s application segment. High-yield, stable formulations reduce waste during production, lower per-serving costs, and streamline labor during high-volume service hours. Industrial bakeries frequently synchronize these high-stability topping formulations with automated processing lines and equipment analyzed in the continuous proofer market.
Procurement contracts frequently include performance benchmarks for whipping yield and stability. Suppliers that deliver consistent results in these areas secure longer-term agreements and preferred status. This dynamic has intensified competition among producers to invest in product development and testing, particularly for liquid whipping toppings where high yield translates to better commercial margins for both the supplier and the buyer. Rising ingredient costs and staffing challenges for bakery clients make reliable performance on these criteria a direct influence on switching behaviors and supplier negotiations in the Non-Dairy Toppings market. Commercial bakeries navigate similar commodity volatility when procuring bulk fats and shortenings tracked in the foodservice B2B vegetable oils market.
Specialty coffee shops and cafés drive a rapid shift in the Non-Dairy Toppings market by prioritizing beverage personalization with plant-based aerosol toppings. Baristas and chain operators focus on differentiated customer experiences, introducing coconut-based and oat-based whipped toppings for customization in hot and cold beverages. Their purchasing decisions are shaped by a dual pressure: responding to consumer demand for dairy alternatives and the operational need for products that integrate seamlessly into high-volume service environments. This segment stands apart from traditional bakery and dessert users by requiring toppings that deliver consistent texture and foam stability in espresso drinks, coffee concentrates formulated for cold brews, and frappés.
Current trends show oat-based sources experiencing the fastest compound annual growth rate at 13.6% among all plant-based topping categories. This signals robust adoption among café operators seeking a neutral flavor and allergen-friendly profile for broad appeal. The move to aerosol formats streamlines serving speed and portion control, directly impacting labor costs and waste reduction in busy café settings. Café chains expanding plant-based offerings to attract younger, health-conscious clientele treat aerosol toppings as a critical differentiator. The market thus sees an influx of innovation and volume growth from foodservice buyers who prioritize operational efficiency, cross-menu versatility, and alignment with evolving dietary trends.
Powdered whipping topping mixes provide the lowest average cost per serving among the main product forms in the Non-Dairy Toppings market. These dry mixes deliver cost advantages by reducing shipping weight, extending shelf life, and minimizing spoilage risk through protective packaging sourced from the barrier paper market, appealing to price-conscious buyers and large-scale foodservice operators. Powdered variants are particularly favored in commercial baking where margin control is critical and bulk preparation is routine. While the fact sheet does not supply explicit unit costs, the forecast for powdered whipping topping mixes reaches USD 426.7 million by 2033, reflecting sustained demand from value-driven segments. In contrast, liquid whipping toppings, forecast to reach USD 1,552.5 million by 2033, tend to carry higher distribution and storage expenses due to their perishable nature but offer more convenience and a superior finished texture, sought after in premium cake and pastry applications.
Pre-whipped toppings offer the greatest convenience but often carry the highest cost per serving. Their ready-to-use format targets end-users with limited preparation capacity or prioritizing speed, including quick service restaurants and institutional catering. This segment’s projected value of USD 573 million by 2033 indicates continued uptake where labor savings outweigh raw material costs. Buyers make trade-offs between ingredient cost, preparation time, and quality outcome, selecting the product form that aligns with their operational priorities and customer expectations.
Expanding adoption of flexitarian and vegan diets significantly raises demand for plant-based products, directly influencing the Non-Dairy Toppings market. Shifts in consumer preferences, especially among younger demographics and urban populations, have led to more frequent household purchases of non-dairy substitutes for traditional toppings. These buyers respond to health, environmental, and ethical concerns, bringing higher volume growth to both retail and foodservice channels. Households that previously purchased only dairy toppings now routinely include plant-based alternatives in weekly grocery baskets. This shift supports a compound annual growth rate of 8.4% from 2026 to 2033, with market value projected to reach USD 2,552.2 million by 2033. Changes in dietary patterns and growing familiarity with plant-based options continue to accelerate the category’s acceptance and penetration across mainstream consumer groups.
Lower household awareness of plant-based whipping toppings restricts uptake in several regions, especially outside established vegan and allergen-sensitive communities. While bakery and foodservice buyers drive the market through direct procurement and recipe development, retail consumers often encounter fewer in-store promotions and limited guidance on product use. This knowledge gap slows trial rates and reduces repeat purchases among mainstream shoppers, leading to smaller volume orders and delayed household adoption. The market experiences slower penetration in demographic segments less exposed to food trends or less actively seeking dairy alternatives, which moderates overall category growth despite rising flexitarian interest elsewhere.
Escalating costs for plant-based raw materials including coconut, almond, and oat derivatives have put sustained pressure on supplier margins in the Non-Dairy Toppings market. Sourcing those ingredients at scale exposes manufacturers to price volatility driven by harvest fluctuations and increased global demand for plant-based inputs across multiple food categories. These higher baseline costs compress margins, particularly for suppliers that contract with bakeries, cafés, and foodservice chains seeking price consistency on large-volume orders. In response, suppliers in the Non-Dairy Toppings market are focused on optimizing procurement strategies, negotiating longer-term contracts with growers, and improving formulation efficiency to stretch each input further. Innovation in blending and emulsification techniques supports efforts to deliver required functionality without escalating finished product prices, yet cost management remains a central challenge for producers aiming to sustain profitability while serving high-growth segments.
Oat-based product formulations present a distinct growth pocket, supported by their projected CAGR of 13.6% through 2033, which outpaces every other source segment. Oat-based options appeal to buyers seeking allergen-friendly and sustainable alternatives to nut or soy products. Manufacturers addressing this demand with scalable oat-based recipes support both retail and foodservice partners, who respond to rising consumer requests for neutral-flavored toppings that blend into a variety of applications without the taste or allergen profile of coconut, almond, or soy. This creates an opportunity for new product launches and expanded menu integration, particularly where consumer preferences are shifting toward more inclusive, plant-forward choices.
The Global Non-Dairy Toppings market is segmented based on Product Form, Application, Source, and Distribution Channel.
Valued at USD 903.1 million in 2026 and projected to reach USD 1,552.5 million by 2033, liquid whipping toppings deliver an 8 percent CAGR over the forecast period. Food manufacturers, bakeries, and commercial kitchens rely on liquid whipping toppings for their ability to create stable whipped textures in cakes, desserts, and specialty beverages. The segment’s growth is fueled by heightened professional and foodservice demand for customizable, ready-to-whip formats that support rapid preparation and consistent performance in high-volume environments. Compared to powdered whipping topping mixes, which grow at a 7.2 percent CAGR, liquid variants attract buyers prioritizing freshness and convenience over minimal cost per serving. Price points for liquid whipping toppings trend higher than other forms in the Non-Dairy Toppings market, reflecting increased processing requirements and specialized packaging. The market’s shift toward premium, allergen-free, and plant-based ingredient lists has raised interest in liquid formulations among bakery chains and institutional buyers seeking differentiated offerings for vegan and lactose-intolerant customers.
Powdered Whipping Topping Mixes segment is estimated to reach USD 426.7 million by 2033, at a CAGR of 7.2% during the forecast period. This segment appeals to industrial bakeries, institutional foodservice, and budget-focused retail buyers who prioritize shelf stability and bulk preparation for large-volume operations. The market benefits when these buyers select powdered mixes for logistical efficiency and extended storage over liquid or pre-whipped alternatives, particularly in regions where cold chain distribution remains limited. Within the Product Form segmentation, powdered whipping topping mixes expand at a slower pace than liquid whipping toppings, which post a recorded 8% CAGR for the same period, signaling that the segment attracts price-sensitive or storage-focused buyers rather than the fastest-growing innovators. Product adoption in this category remains tied to cost control and operational simplicity, with demand most resilient where buyers optimize for ingredient longevity and rapid reconstitution in commercial kitchens. The market expands volume with these users, while several buyers transition toward more premium or ready-to-use formats.
Pre-Whipped Toppings segment is expected to reach USD 573 million by 2033. These ready-to-use products offer convenience for commercial bakers, foodservice chains, and institutional buyers seeking to streamline operations and save preparation time. The market sees this segment favored in high-throughput environments including quick-service restaurants and large-scale bakeries, where consistent quality, speed, and reduced labor are priorities. Demand growth for pre-whipped formats is closely linked to the rise in out-of-home consumption and the expansion of dessert menus beyond traditional bakery settings. Compared to liquid whipping toppings, pre-whipped options trade flexibility for time savings, appealing to buyers focused on operational efficiency rather than cost per serving. Within the market, this segment registers a slower CAGR than both liquid and powdered alternatives, reflecting its mature position and steady uptake among professional users who value convenience over customization or ingredient control.
USD 671 million in sales is projected for this segment in 2026, with demand expected to reach USD 1,119.4 million by 2033, delivering a CAGR of 7.6 percent across the forecast period. Non-dairy toppings in cakes and pastries are driven by growing adoption among urban bakeries, commercial patisserie chains, and premium home bakers focused on allergen-free and vegan menu expansion. Health-conscious consumers and those with lactose intolerance are now key buyers, prompting suppliers to develop products with improved mouthfeel and aeration while avoiding dairy ingredients. Compared to the desserts and mousses segment, cakes and pastries deliver a slower pace of expansion - 7.6 percent versus 8.8 percent CAGR - reflecting mature penetration in professional and specialty bakery channels that prize consistent whip volume and shelf stability. Demand in this sub-segment responds strongly to new product launches by brands catering to bakery operators who require predictable functional performance, setting it apart from the more trend-sensitive growth seen in dessert applications. Suppliers active in the Non-Dairy Toppings market target this segment through tailored product lines that address bakery-specific needs, supporting its sustained value and volume.
Estimated to reach USD 565.8 million by 2033, desserts and mousses are forecast to deliver an 8.8 percent CAGR - the fastest growth among the major application sub-segments for non-dairy toppings where data is available. This category caters to commercial dessert manufacturers, patisseries, and hospitality operators who rely on plant-based toppings to deliver texture, flavor, and decorative appeal without dairy content. Increased demand for vegan, allergen-free, and lactose-intolerant dessert options has accelerated adoption in this application, particularly among younger consumers and urban markets. Compared with cakes and pastries, which are projected to grow at a 7.6 percent CAGR, desserts and mousses outpace traditional bakery uses due to the broader variety of non-dairy dessert concepts entering foodservice and retail. Suppliers have prioritized clean-label ingredients and improved aeration performance to capture a larger share of value-added dessert innovation in this segment, reflecting the market’s ongoing diversification with new product launches targeting desserts and mousses.
Ice Cream and Frozen Desserts segment is expected to reach USD 339.2 million by 2033. Demand within this category centers on manufacturers and foodservice providers focused on meeting the preferences of consumers seeking plant-based frozen treats. This segment reflects the influence of seasonal product launches and limited-time flavors, particularly among younger buyers and families with dietary restrictions. Compared to Cakes and Pastries, which show a higher absolute value and a 7.6% CAGR, the Ice Cream and Frozen Desserts segment is positioned for steady contribution but does not match the same scale or pace. Product development in this segment frequently prioritizes texture retention at low temperatures and resistance to melting, which differentiates it from dessert and pastry applications where stability at ambient or refrigerated conditions takes precedence. Ingredient choices and fat profiles are tailored to deliver smoothness and mouthfeel similar to dairy-based toppings, supporting the ongoing shift toward clean-label and allergen-free options in frozen dessert settings.
Projected to grow at a CAGR of 10.3% during the forecast period, beverages stand out for their strong momentum in the Non-Dairy Toppings market. This segment is integral to specialty drinks, ranging from cold-foam coffee beverages to non-dairy milkshakes, where foodservice operators and café chains drive innovation. Demand is propelled by younger, urban consumers seeking plant-based, allergen-free options, and beverage chains responding with new menu items that incorporate non-dairy toppings for visual appeal and flavor variety. Compared to cakes and pastries at a 7.6% CAGR and desserts and mousses at an 8.8% CAGR, beverages deliver the fastest-paced expansion among application segments in the Non-Dairy Toppings market. This growth reflects a shift in consumption patterns toward customization and on-the-go formats. Suppliers differentiate their offerings by focusing on foam stability, neutral flavor, and fast-dissolving properties, which are critical in beverages but less so in dessert or bakery applications.
Fruit preparations and breakfast dishes use non-dairy toppings to add flavor, texture, and visual appeal in both home and foodservice settings. This segment attracts health-conscious consumers who seek plant-based alternatives for their morning meals, smoothie bowls, waffles, and fruit compotes. Demand is influenced by the growing preference for allergen-friendly toppings that cater to lactose-intolerant or vegan buyers, setting it apart from segments focused on cakes, pastries, or desserts. While cakes and pastries drive higher volumes and present stronger commercial incentives, the Others (Fruit Preparations, Breakfast Dishes) segment benefits from breakfast menu innovation and the rise of customizable, clean-label products. Adoption in this segment is shaped by versatility and the ability to integrate with a wide range of sweet and savory applications, giving manufacturers opportunities to differentiate through formulation and packaging. Unique consumer habits in this segment expand the range of non-dairy topping occasions beyond traditional bakery and dessert channels, supporting incremental growth for suppliers.
Valued at USD 420.3 million in 2026 and projected to reach USD 757.2 million by 2033, this segment is forecast to deliver an 8.8 percent CAGR, surpassing the historical average for plant-based toppings. Coconut-based toppings serve bakery manufacturers, dessert producers, and foodservice suppliers seeking clean-label, allergen-friendly alternatives to dairy. The market increasingly aligns with health-conscious consumer demands for plant-origin and lactose-free ingredients, driving preference for coconut-based formulations. This segment's growth outpaces almond-based toppings, supported by a higher CAGR of 8.8 percent compared to almond-based’s 8.7 percent, reflecting broader adoption in application areas where distinctive coconut flavor and creamy mouthfeel are prized. Market expansion is further influenced by product launches from brands focused on vegan and allergen-free portfolios, responding to shifting dietary patterns. Coconut-based offerings attract both premium bakery chains and consumers seeking indulgence without dairy, differentiating on taste and compatibility with tropical and fusion dessert menus.
Almond-Based segment is estimated to reach USD 309.8 million by 2033, at a CAGR of 8.7% during the forecast period. Almond-based toppings appeal to buyers prioritizing allergen-friendly and plant-derived ingredients, particularly in premium cake, bakery, and dessert applications for both retail and foodservice channels. Strong demand in this segment comes from consumers seeking lactose-free and soy-free options, especially in Western Europe and North America, where almond flavor is widely accepted in bakery and patisserie segments. Compared to coconut-based toppings, almond-based variants deliver a marginally slower CAGR - 8.7% versus 8.8% - reflecting the higher cost of almond ingredients and sensitivity to raw material price fluctuations. Growth in this segment is influenced by rising consumer awareness of clean-label and fortified ingredients, supporting product differentiation for manufacturers and foodservice operators. Almond-based ingredients deliver a specialized profile distinguished by their regional popularity and suitability for allergen-sensitive and flavor-focused product development in this segment.
Soy-Based segment is expected to reach USD 429.5 million by 2033. This segment primarily serves buyers requiring allergen-friendly alternatives or those with dietary restrictions seeking lower-cost plant-based options in the Non-Dairy Toppings market. Foodservice operators and manufacturers often select soy-based toppings when value and protein content matter more than premium flavor or texture, especially compared to coconut- and almond-based offerings. The market for soy-based options is influenced by cost stability and established sourcing channels, which appeal to institutional buyers and bakery chains aiming to manage input expenses. Unlike the oat-based segment, which is projected to grow faster in the Non-Dairy Toppings market, soy-based toppings deliver a steadier presence, attracting traditional consumers who prioritize familiarity and affordability. Regulatory clarity around soy protein labeling and wider global acceptance support consistent adoption, while fluctuating consumer perceptions of soy’s health profile introduce modest headwinds relative to newer alternatives.
Projected to grow at a CAGR of 13.6% during the forecast period, oat-based products deliver the fastest expansion among source categories in the Non-Dairy Toppings market. Oat-based toppings are chosen by foodservice operators and manufacturers prioritizing allergen-friendly and sustainable ingredients for cakes, pastries, and beverages. Consumers seeking alternatives to coconut- or soy-based options increasingly select oat-based variants for their neutral taste and digestive tolerance. The segment appeals to buyers who value clean-label, plant-based products and want to avoid common allergens. Compared with the coconut-based segment, which is forecast at an 8.8% CAGR, oat-based products expand at a much quicker pace, reflecting heightened demand from both retail and foodservice channels. Preference for oat in ingredient selection is supported by its lower allergenic risk, which enables product placement in schools and health-focused retailers. Product innovation and brand investment within the market advance oat-based offerings, strengthening their presence among flexitarian and health-motivated consumers.
Alternative bases including rice, cashew, or pea protein distinguish this segment from the more established coconut, almond, soy, and oat-based options. These products serve specialized dietary needs and address rising demand for hypoallergenic or niche plant-based formulations. Foodservice buyers and health-conscious consumers use these alternatives when major allergens are avoided or when conventional bases do not match regional preferences. Product launches in this segment target vegan, allergen-sensitive, and ethnic consumer groups, driving adoption despite higher formulation costs. Compared to coconut and almond-based toppings, alternatives in the Others segment typically involve greater ingredient sourcing complexity and regulatory scrutiny, resulting in steeper production costs and often higher price points for the end user. The broadening ingredient landscape accelerates shifts among buyers seeking greater diversity in texture, flavor, and allergen profile, which differentiates this segment from higher-volume, faster-growing categories.
Supermarkets and Hypermarkets segment is valued at USD 422.9 million in 2026 and is projected to reach USD 693.2 million by 2033, at a CAGR of 7.3% during the forecast period. This channel serves the primary route for retail consumers seeking convenient access to a broad selection of non-dairy toppings, particularly for home baking, desserts, and everyday consumption. Large urban grocery chains and hypermarket outlets focus on stocking prominent brands and private label offerings, catering to families and individual buyers who prioritize variety and price transparency. Growth in this segment is driven by the mainstreaming of plant-based diets and rising awareness of lactose intolerance, which translates into higher volume purchases for both routine and special-occasion usage. Supermarkets and hypermarkets command a higher absolute value than convenience stores or online retail by 2033, reflecting their wider penetration and established shopper trust. Compared to the foodservice segment, supermarkets and hypermarkets exhibit a slower CAGR, signaling relatively mature adoption among household buyers in the market.
Estimated to reach USD 148.3 million by 2033, the Convenience Stores segment is projected to grow at a CAGR of 6.6 percent during the forecast period. These retail outlets primarily serve urban consumers seeking quick access to prepared and packaged non-dairy toppings for home consumption and immediate use. Growth in this channel is driven by increasing urbanization and the preference for single-serve, ready-to-eat products among younger demographics and working families. Compared to supermarkets and hypermarkets, where wider product ranges and bulk packaging dominate, convenience stores focus on portability and smaller pack sizes that command higher per-unit prices but lower overall volumes. The segment’s CAGR of 6.6 percent is slower than the 7.3 percent seen in supermarkets and hypermarkets, reflecting more limited product variety and shelf space. Convenience stores provide a critical access point for impulse and last-minute purchases, catering to buyers who prioritize accessibility and speed over selection.
Online Retail segment is expected to reach USD 318.3 million by 2033. This channel is shaped by consumers who prefer the convenience of direct-to-door delivery and digital selection, particularly younger urban buyers and those seeking a wider assortment of brands. Demand in online channels is driven by the increasing comfort with e-commerce platforms and the marketing reach of third-party grocery applications. Unlike supermarkets and hypermarkets, online retail supports smaller brands that do not have traditional shelf presence, expanding the product mix available to consumers. While the segment trails supermarkets and hypermarkets in overall sales value, it attracts a different buyer profile - tech-savvy, health-conscious, and often seeking products with specific free-from or plant-based claims. Online retail is further influenced by the prevalence of promotional pricing, digital reviews, and influencer marketing, differentiating it from brick-and-mortar outlets that rely more on in-store displays and immediate availability.
Growth in foodservice is projected at a CAGR of 8.2% during the forecast period, reflecting strong adoption by commercial bakeries, quick-service restaurants, and catering providers seeking consistent, scalable topping solutions for high-volume orders. These buyers rely on non-dairy toppings for applications ranging from bakery fillings to decorative finishes on desserts, driven by rising demand for allergen-friendly and vegan menu options. Foodservice buyers make purchasing decisions based on functional stability and the ability to maintain taste and texture after extended holding periods or refrigeration, distinguishing this segment from retail channels including supermarkets and online retail, where consumer preferences for packaging and portion size weigh more heavily. The segment benefits from menu innovation and the need for inclusivity in ingredient lists, which supports higher average order sizes than convenience stores or online retail. Compared with supermarkets and hypermarkets, foodservice delivers a faster CAGR during the forecast period, contributing to the overall expansion of the market.
Based on geography, the Global Non-Dairy Toppings market is divided into North America, Europe, Asia-Pacific, South America, Middle East, and Africa.
Demand in the United States, Canada, and Mexico is shaped by the widespread presence of plant-based consumer segments and large-scale food manufacturers seeking dairy-free alternatives. Leading food processors and bakery chains in these countries increasingly specify non-dairy formulations to address allergen regulations and shifting consumer preferences, supporting higher value sales. North America is projected to reach USD 723.8 million by the end of 2033, with demand already concentrated in this region. In this region, the Non-Dairy Toppings market benefits from well-established retail networks and strong product innovation, particularly in urban centers where new product launches target vegan and flexitarian buyers. Growth in the Non-Dairy Toppings market is further supported by premium pricing in the United States and the willingness of Canadian and Mexican consumers to try specialty items featuring alternative ingredients.
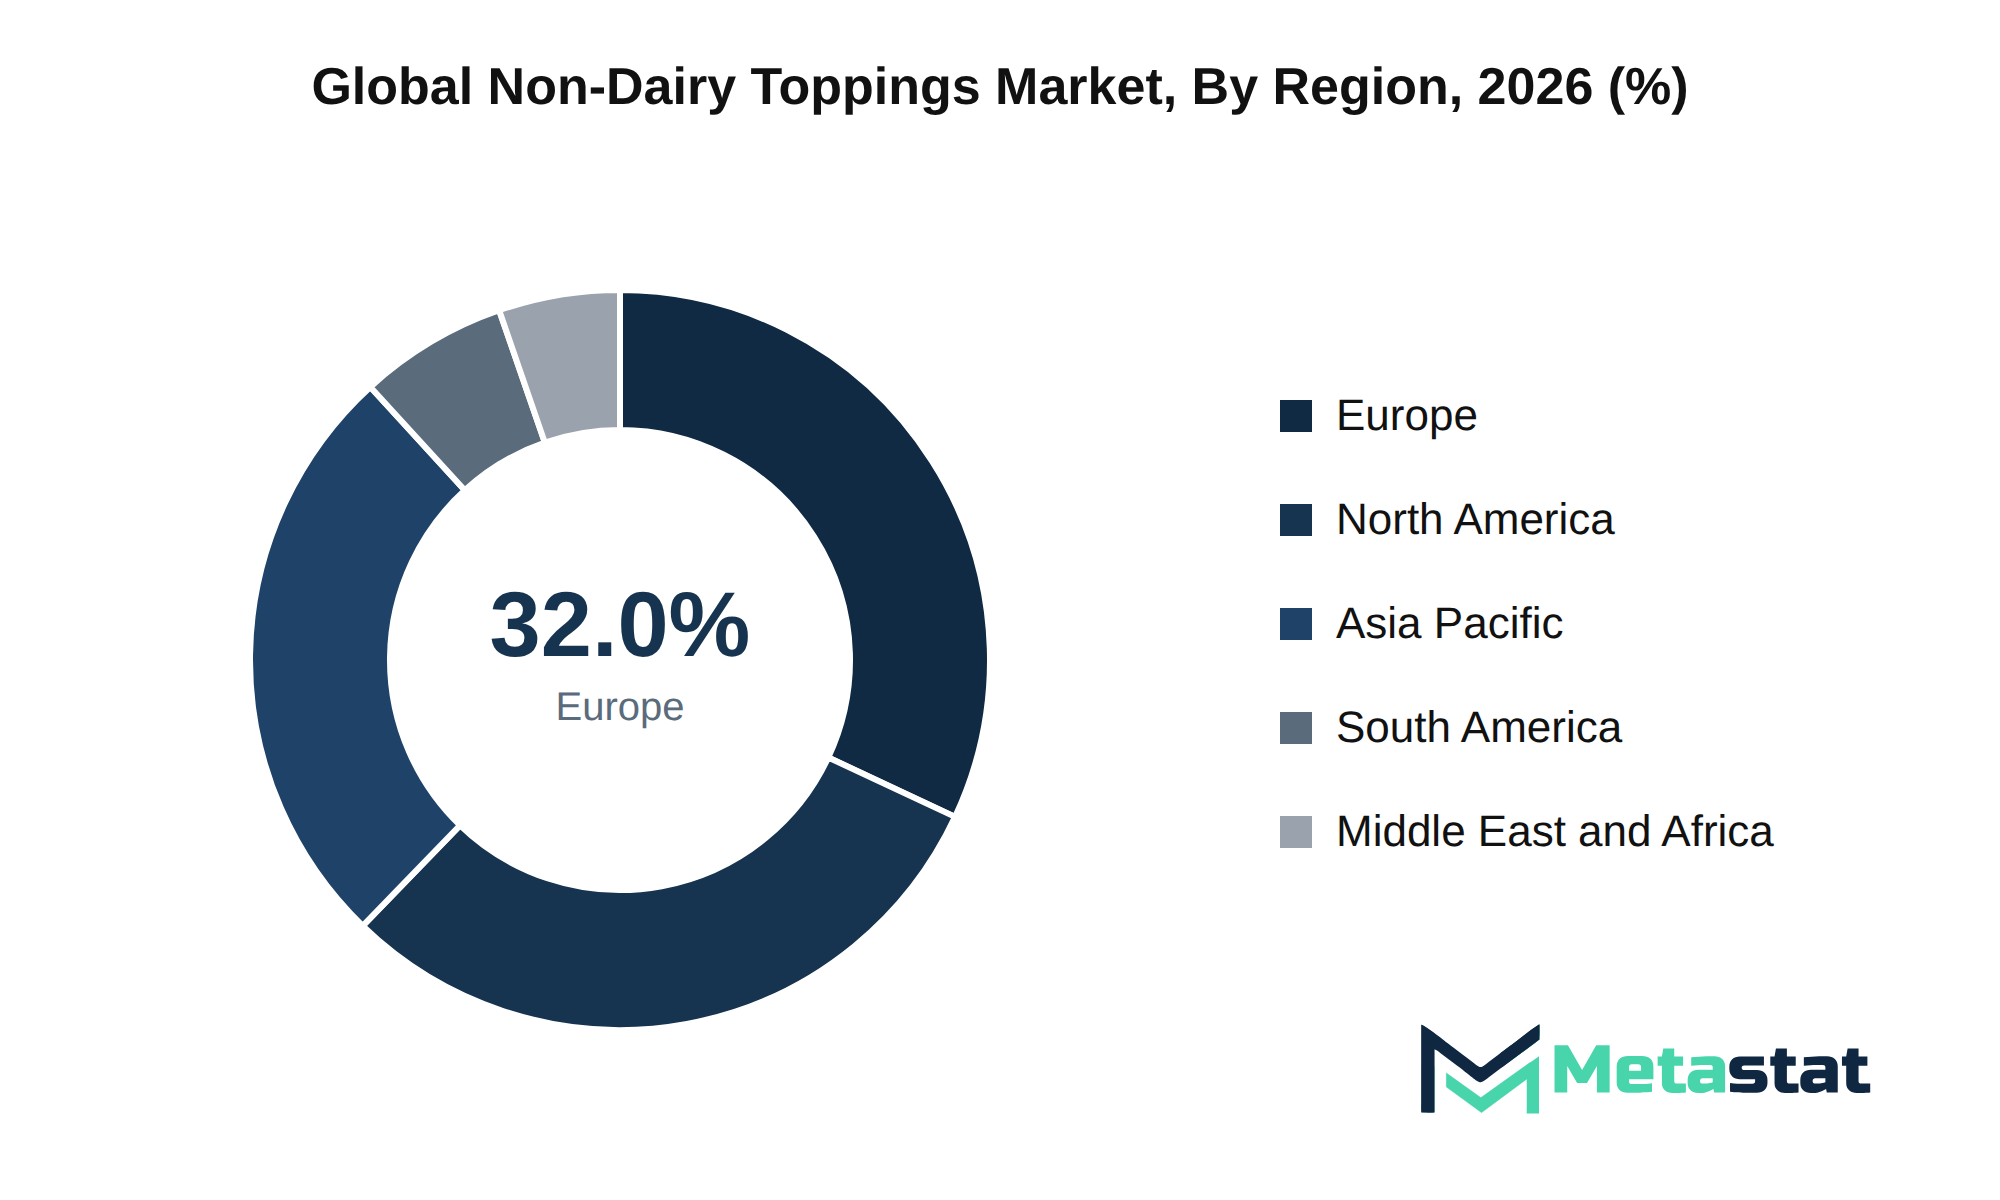
Bakery and patisserie sectors in Germany, France, and Italy prioritize plant-based innovation, driving a strong shift toward non-dairy alternatives. Consumer demand for vegan-certified, allergen-free, and clean-label toppings in the UK and Spain strengthens product differentiation, with manufacturers tailoring formulations to address both dietary preferences and food safety requirements. The Non-Dairy Toppings market in Europe accounts for 32.00% of global revenue in 2025, reflecting a mature infrastructure for plant-based foods and widespread acceptance among retail and foodservice buyers. Product launches in Russia and the Rest of Europe further accelerate variety and accessibility, supporting broader adoption across both premium and mainstream price points. Regional integration of strict labeling standards and ingredient quality controls supports consumer confidence and advances the competitive position of European brands in this segment.
Rapid urbanization and rising incomes across China, India, and Southeast Asia have accelerated consumer demand for plant-based alternatives in bakery, dessert, and café channels. The market in Asia Pacific accounted for 26.00% of global sales in 2025, reflecting an expanding base of health-conscious buyers and a surge in premium Western-style patisserie formats. Local manufacturers in India and China have introduced regionally adapted products to appeal to preferences for coconut and soy-based formulations, supporting greater adoption in both retail and foodservice categories. Japan and South Korea display strong demand from established bakery chains and convenience outlets, where high product turnover and a focus on innovative textures drive regular re-stocking. Australia’s specialty grocers and premium food retailers attract consumers seeking allergen-free and vegan options, further strengthening the regional market's depth. Regulatory standards and ingredient sourcing requirements vary across the region, requiring suppliers to tailor offerings for each country’s unique dietary and labeling expectations. The market in Asia Pacific benefits from this intersection of demographic growth, urban retail expansion, and evolving consumer preferences.
Brazil and Argentina anchor demand in South America, reflecting robust bakery and confectionery industries that rely on plant-based alternatives to address shifts in dietary preferences and intolerance concerns. Local producers and importers supply a growing segment of urban consumers seeking dairy-free cake, pastry, and dessert toppings for both retail and foodservice channels. Retailers across major cities have broadened offerings of coconut- and soy-based options, responding to middle-class demand for clean-label and vegan-certified products. Brazil frequently serves the region as the primary distribution and innovation hub for South American launches, supporting new product introductions and brand visibility. While product awareness remains lower in rural areas, marketing initiatives in metro regions and increased collaboration between local bakeries and suppliers support steady category expansion. The market in South America is influenced by local ingredient sourcing challenges and variability in consumer purchasing power, which shape the speed and scope of new product adoption.
Specialty coffee chains and upscale bakeries in Saudi Arabia, the UAE, and South Africa are expanding their plant-based offerings to reflect a growing base of health-focused urban consumers. Manufacturers respond to this shift with non-dairy toppings that offer longer shelf stability in high-temperature environments, addressing the operational realities of retailers and foodservice operators in the region. The region maintains steady but specialized demand compared to more mature geographies, reflecting unique consumption patterns and market requirements. Adapting product formulations to align with halal certification requirements and sensitivities around imported ingredients remains a commercial priority for suppliers targeting this market. Demand in the Middle East and Africa is influenced by the preferences of younger consumers seeking both convenience and plant-based novelty in urban centers.
Competition in the Non-Dairy Toppings market intensifies while suppliers differentiate through product innovation, ingredient sourcing, and the ability to serve evolving dietary preferences. Buyers prioritize factors including clean label formulations, allergen-free claims, and plant-based ingredient certifications. Price sensitivity remains important for high-volume clients in foodservice and bakery channels, while retail buyers increasingly favor sustainability credentials and distinctive flavors.
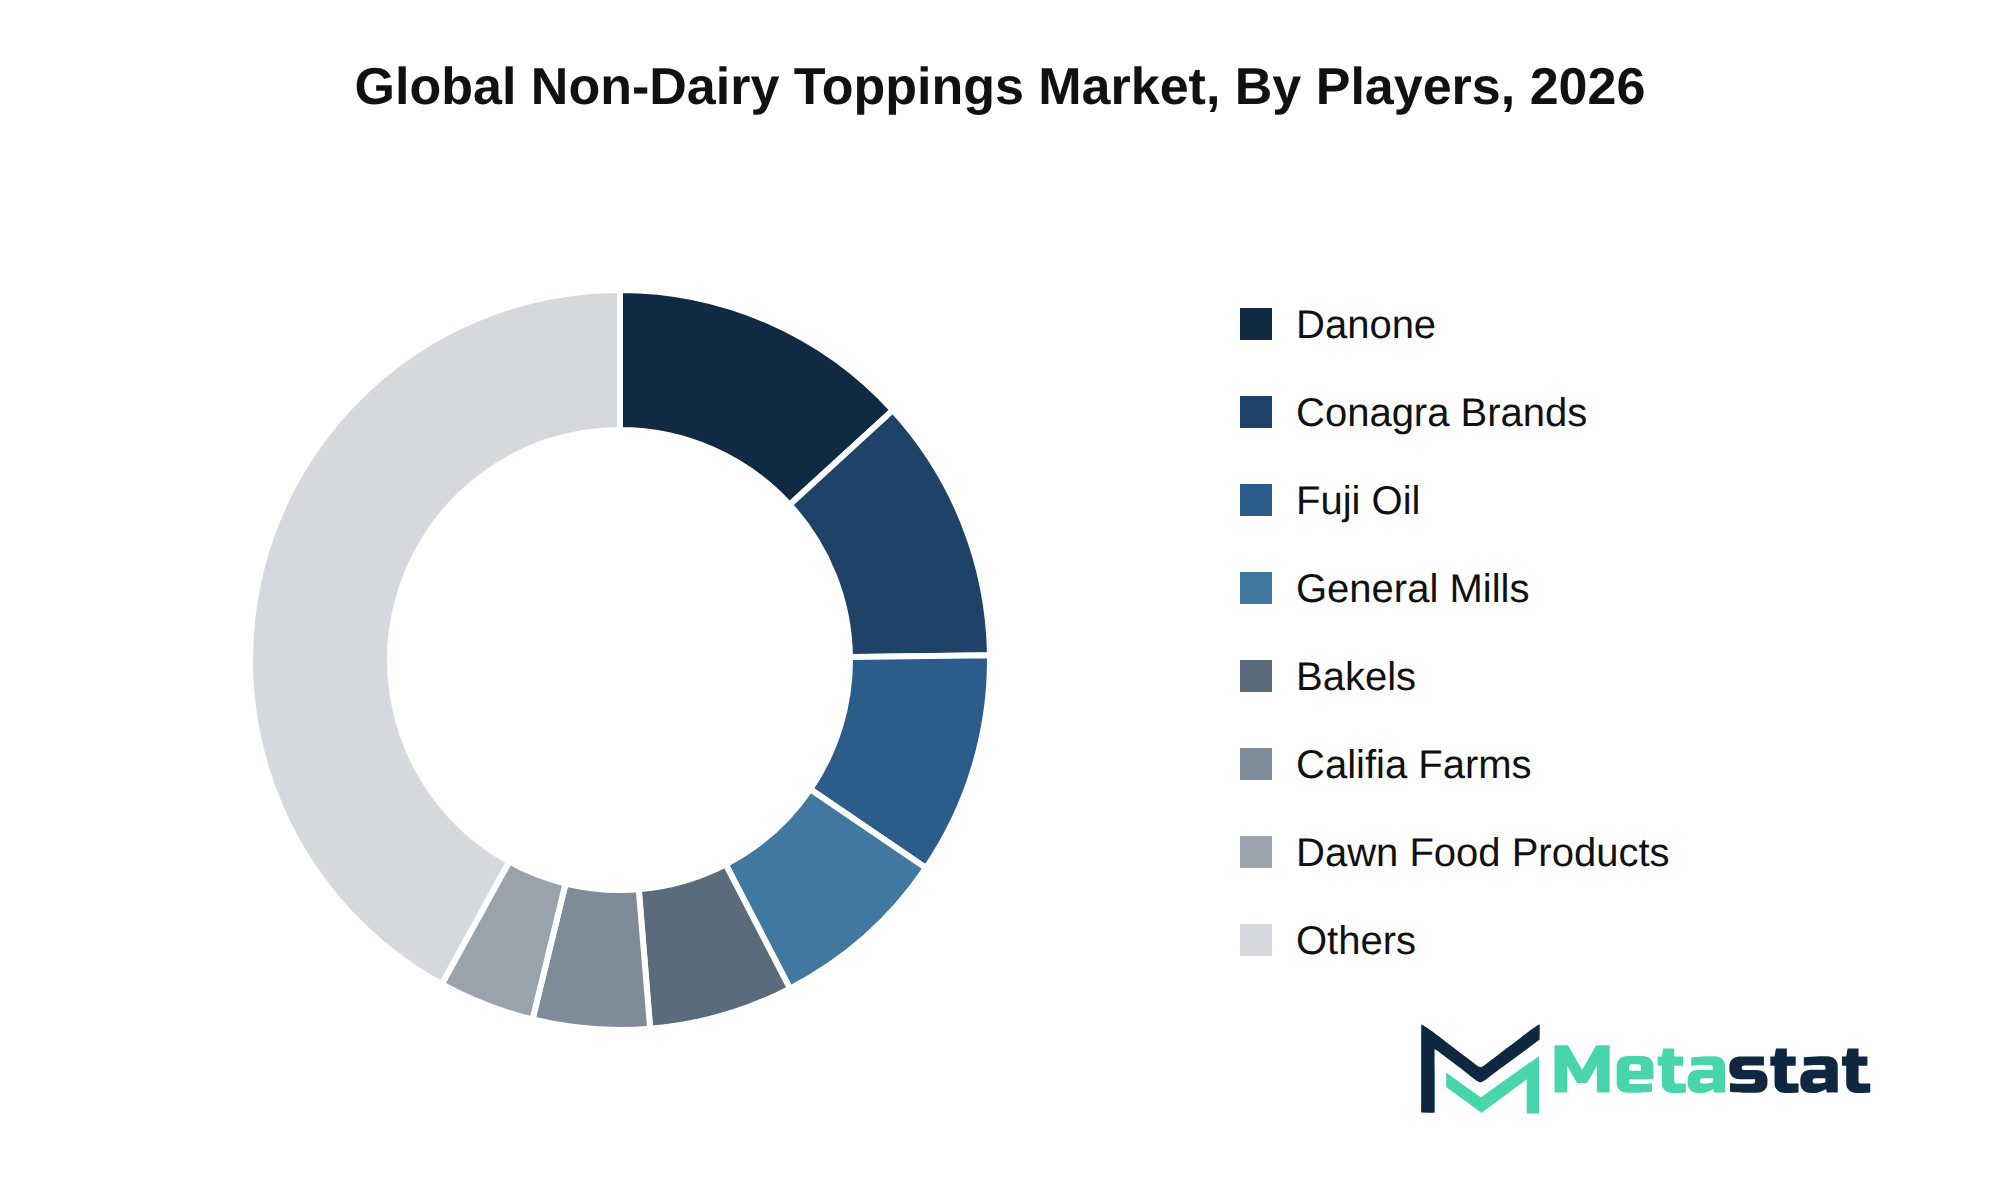
Several companies position their offerings to address these buyer preferences. Califia Farms, LLC focuses on plant-based product innovation, appealing to health-oriented consumers seeking premium options. Oatly Group AB emphasizes oat-based formulations, responding to rising interest in alternative sources and dairy-free diets. So Delicious Dairy Free targets allergen-conscious segments through a portfolio that excludes major allergens and delivers broad retail availability. Meanwhile, Fuji Oil Co., Ltd. invests in developing coconut-based and soy-based variants, catering to demand for diverse ingredient origins and supporting foodservice partners that require customizable solutions. Competitive strategy in this market often revolves around balancing cost efficiency with the flexibility to address emerging trends and customer-specific requirements.
Growth to this level depends primarily on sustained expansion in the liquid whipping toppings segment, which is projected to reach USD 1,552.5 million by 2033. Rising demand for non-dairy alternatives among health-conscious consumers and those with dietary restrictions drives adoption in the cakes and pastries application, supported by an increase in specialty bakery outlets and innovation in product formulations. Europe, holding the largest regional share at 32%, is expected to continue leading volume and value, benefiting from established plant-based product preferences and robust retail infrastructure.
Ongoing product development, especially oat-based and coconut-based toppings, further supports revenue growth by catering to consumers seeking allergen-free and clean-label options. However, the main risk to the forecast lies in the volatility of raw material prices for plant-based ingredients, particularly in Asia Pacific, where supply chain complexity and agricultural seasonality introduce uncertainty for manufacturers. If ingredient costs or availability become less predictable, suppliers face margin pressure, which could restrict expansion in price-sensitive regions. Meeting the 2033 forecast will require stable sourcing and continued product adaptation to evolving consumer preferences.
By Product Form: Liquid Whipping Toppings, Powdered Whipping Topping Mixes, Pre-Whipped Toppings
By Application: Cakes and Pastries, Desserts and Mousses, Ice Cream and Frozen Desserts, Beverages, Others (Fruit Preparations, Breakfast Dishes)
By Source: Coconut-Based, Almond-Based, Soy-Based, Oat-Based, Others
By Distribution Channel: Supermarkets and Hypermarkets, Convenience Stores, Online Retail, Foodservice
The report strategically identifies and profiles the key market players and analyses their core competencies in each sub-segment of the Non-Dairy Toppings market.
|
Report Attributes |
Details |
|
Study Period |
2021-2033 |
|
Base Year |
2025 |
|
Estimated Year |
2026 |
|
Forecast Period |
2026-2033 |
|
Historical Period |
2021-2025 |
|
Growth Rate |
CAGR 8.4% from 2026 to 2033 |
|
Revenue Unit |
USD million |
|
Segmentation |
By Product Form, Application, Source, Distribution Channel, and Region |
|
By Region |
North America (By Product Form, Application, Source, Distribution Channel, and Country)
|
|
|
|
Asia Pacific (By Product Form, Application, Source, Distribution Channel, and Country)
|
|
|
|
|
Middle East and Africa (By Product Form, Application, Source, Distribution Channel, and Country)
|
Find answers to common questions about this report
The Non-Dairy Toppings market size was valued at USD 1,338.3 million in 2025.
The projected growth rate is a CAGR of 8.4% during the forecast period from 2026 to 2033.
The North America Non-Dairy Toppings market size is estimated to reach USD 723.8 million by 2033.
Liquid Whipping Toppings leads by product form, reaching USD 1,552.5 million in 2033, the highest value among all type segments. This segment outpaces Powdered Whipping Topping Mixes and Pre-Whipped Toppings based on forecast value.
Expanding adoption of flexitarian and vegan diets among younger and urban consumers is raising demand for plant-based toppings. Oat-based product formulations are driving growth by appealing to buyers seeking allergen-friendly and sustainable alternatives.
Europe holds the dominant share with 32.0 percent of the total market, based on regional share percentages. North America follows with 30.3 percent.
Lower household awareness of plant-based whipping toppings restricts uptake in several regions, especially outside established vegan and allergen-sensitive communities. Escalating costs for plant-based raw materials including coconut, almond, and oat derivatives have put sustained pressure on supplier margins.
Adoption is favored by rising demand from flexitarian and vegan consumers, increased household purchases driven by health and ethical concerns, and the appeal of allergen-friendly oat-based formulations, which are projected to grow at a CAGR of 13.6 percent through 2033.
The Non-Dairy Toppings market is estimated to reach a valuation of USD 2,552.2 million by 2033.
Companies active in the non-dairy toppings sector include Bakels Group, Blue Diamond Growers, Califia Farms, LLC, Conagra Brands, Inc., Danone S.A., General Mills, Inc., and So Delicious Dairy Free.
The analysts below cover Food and Beverages research at Metastat Insights.
LEAD ANALYST
Utkarsh Khirodkar is a Lead Market Research Analyst at MetaStat Insight, specializing in market intelligence, technology sector assessments, and competitive strategy.

LEAD PRINCIPAL ANALYST, PHARMA AND HEALTHCARE
Food and Beverages · Healthcare · Healthcare IT · Medical Devices
Ajay Devgire is the Lead Healthcare Analyst at MetaStat Insight, leading strategic research and market intelligence initiatives across the global healthcare domain.

SENIOR RESEARCH ANALYST
Biotechnology · Food and Beverages · Medical Devices · Packaging
Snehal Pasalkar is a Research Analyst at MetaStat Insight, operating at the intersection of life sciences research, competitive strategy, and market intelligence.
When evaluating distributed energy resource management systems, standard research summaries tend to gloss over the operational differences between front-of-the-meter utility deployments and behind-the-meter industrial sites. The MetaStat Insight report addressed those distinctions directly, especially regarding software interoperability standards and grid interconnection backlogs. The five-year market sizing across regional transmission organizations provided actionable context for our grid modernization strategy.
Most industry reports on warehouse automation bundle autonomous mobile robots and fixed conveyor installations into the same top-level numbers, which complicates advisory work. This study split the market cleanly by payload tiers, navigation technology, and fleet management software layers. The regional forecast for Western Europe gave our team defensible adoption benchmarks when evaluating capital allocation for logistics clients, saving us days of secondary data scrubbing.
Analyzing the transition from natural gas to green hydrogen in iron ore reduction requires realistic infrastructure timelines. Meta stat insight supplied a detailed regional assessment of DRI plant conversion costs and scrap metal availability in North America and Western Europe. Their report carefully examined pellet quality specs and electrical grid access constraints without making oversimplified market assumptions. The research material served as a practical reference during internal technology roadmap discussions.
Explore related market intelligence reports worth reading alongside this one.