
LEAD ANALYST
Utkarsh Khirodkar is a Lead Market Research Analyst at MetaStat Insight, specializing in market intelligence, technology sector assessments, and competitive strategy.

Carbon Footprint Management Market By Deployment Mode (On-Premises and Cloud-Based), By Organization Size (Large Enterprises, Small and Medium Enterprises (SMEs)), By Vertical (Energy, Utilities, Manufacturing, Residential, Commercial Buildings, Transportation, Logistics, IT, Telecom, and Others), Industry Analysis, Size, Share, Growth, Trends, and Forecast, 2033
Report ID
MSI-4307
Published
October, 2025
Pages
255 Pages
Format
Report Details
Choose Your License
Carbon Footprint Management Market
The global carbon footprint management market in the environmental sustainability field has been gradually making headway since the early 2000s due to increased sensitivity towards climate change and the realization of the necessity of organizational measurement and carbon footprint reduction. Its origin goes back to when carbon accounting systems and voluntary reporting schemes started appearing, wherein organizations first started measuring their environmental footprint. Early on, adoption was confined to large-scale business in Europe and North America that were under pressure from governments and socially responsible investors to prove accountability in the control of emissions.
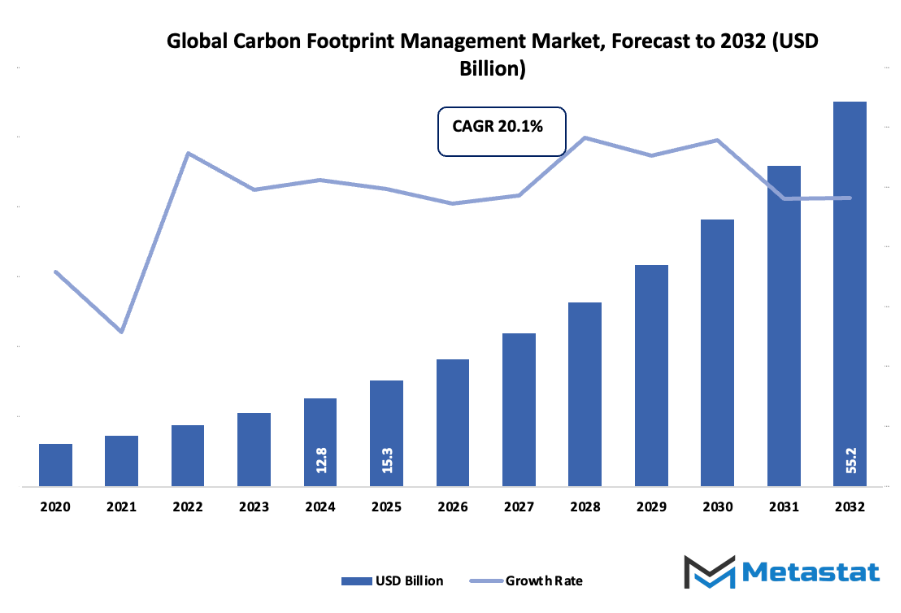
Global carbon footprint management market size around about USD 15.3 Billion in 2025 at a growth rate of about 20.1% from 2032, with the possibility of increasing beyond USD 55.2 Billion.
On-Premises capture approximately 42.8% market share, focusing on high-stakes research for driving innovation and broadening applications.
Key trends fueling growth: Greater regulatory pressure toward emission reporting and lowering emissions, Corporate commitment rising toward net-zero ambitions and sustainability
Prospects exist in: Rising adoption of digital solutions and AI-driven emission management software
Key takeaway: The market is poised to grow exponentially in value over the coming decade, with huge growth potential.
A turning point came when traditional practices were put in place, enabling firms to quantify carbon emissions more precisely. The Kyoto Protocol exerted a devious but powerful influence through the establishment of a global environment in which international agreements and carbon trading philosophies became more viable, prompting businesses to experiment with non-reporting carbon management options. By the 2010s, technologies like cloud software, real-time data tracking, and analytics software applications began to revolutionize the way organizations tracked emissions. Firms could no longer wait for yearly reporting cycles but could track carbon footprints of supply chains and operational activities near-real-time. Consumer behavior also began to power the market. These, customers began preferring companies that demonstrated transparency in sustainability efforts.
This pushed companies not only to quantify emissions, but to cut them and report to stakeholders. Governance frameworks followed suit in the form of insisting on tougher reporting of emissions and adoption of energy-efficient systems. These developments further influenced other sectors like manufacturing, transport, and retail to adapt Carbon Footprint Management into strategic thinking. Today, the market extends to include sophisticated platforms that provide predictive analytics and auto-recommendations for emissions savings. Businesses are now starting to connect financial and business performance with carbon management, recognizing efficiency and sustainability as interdependent. In the future, the worldwide Carbon Footprint Management market will be more accessible to small and medium-sized businesses with the help of AI-powered analytics, IoT device connectivity, and stronger policy incentives.
Its direction promises an upcoming time in which carbon administration is a standard, evidence-based business decision-making element that permeates very profoundly throughout corporate life and consumer expectations.
The global carbon footprint management market is mainly classified based on Deployment Mode, Organization Size, Vertical.
On-Premises: Organizations can deploy their Carbon Footprint Management systems on their own systems via the on-premises option. Complete control of data, security, and customization of the system is offered. It is the ideal choice for organizations that need utmost compliance with internal regulations and data governance along with complete control over operations.
Cloud-Based: Cloud-based deployment allows organizations to access Carbon Footprint Management applications over the internet without physical infrastructure. The approach provides flexibility, scalability, and simpler updating. It allows organizations to effectively manage emissions data with minimal start-up costs and maintenance, which is ideal for those organizations seeking speedy deployment and remote access.
Large Corporations: Large corporations implement Carbon Footprint Management solutions to manage and minimize their extensive environmental footprint. Large corporations possess sufficient resources to leverage cutting-edge systems across geographies. The solutions assist in complying with regulations, achieving sustainability objectives, and providing end-to-end reporting on emissions to stakeholders and investors.
Small and Medium Enterprises (SMEs): SMEs implement Carbon Footprint Management solutions to make the most of resources and minimize operational emissions at economic cost. It is easy for such businesses to switch to solutions that do not demand heavy infrastructure investment. Solutions enable SMEs to make the transition to sustainable practices over time, become more efficient, and even ensure compliance with local as well as global environment legislation.
Energy and Utilities: The energy and utilities industry revolves around Carbon Footprint Management solutions that monitor production, distribution, and consumption of energy emissions. These solutions ensure maximum efficiency of energy, detect emission hotspot areas, and enable integration of renewable energy. Carbon production must be monitored to keep up with regulatory compliance as well as to set up long-term goals for sustainability.
Manufacturing: Carbon Footprint Management tracks carbon on production and supply chains in manufacturing. Solutions conserve resources, minimize waste, and reduce energy use. Businesses can conserve on environmental footprint while ensuring productivity and fulfilling sustainability obligations by tracking carbon emissions.
Residential and Commercial Buildings: Solutions in this vertical track energy consumption emissions of building, space heating and cooling, and building operational activities. Carbon Footprint Management solutions allow building managers to enforce energy-saving strategies, optimize operating efficiency, and lower overall environmental footprint. These solutions are vital in meeting sustainable building standards and certifications.
Transportation and Logistics: Within transportation and logistics, Carbon Footprint Management emphasizes fuel usage, route optimization, and fleet efficiency. Solutions lower vehicle emissions, streamline planning operations, and monitor environmental performance. It helps businesses to boost sustainability and cost savings while addressing regulatory compliance and customers' demands for green logistics.
IT and Telecom: Carbon Footprint Management is employed by IT and telecom businesses to track energy usage in data centers, networks, and operations. The solutions allow for energy savings, efficiency gains, and green IT support. Tracking emissions enables businesses to prove their green initiative and implement sustainable long-term plans.
Others: Carbon Footprint Management solutions are employed by other industries that have unique operational requirements. Solutions enable the identification of emission sources, optimization of processes, and minimization of environmental footprints. Solutions make recommendations that are actionable for various industries in order to achieve sustainability, ease compliance, and assist in environmental responsibility programs.
|
Forecast Period |
2025-2032 |
|
Market Size in 2025 |
$15.3 Billion |
|
Market Size by 2032 |
$55.2 Billion |
|
Growth Rate from 2025 to 2032 |
20.1% |
|
Base Year |
2025 |
|
Regions Covered |
North America, Europe, Asia-Pacific, South America, Middle East & Africa |
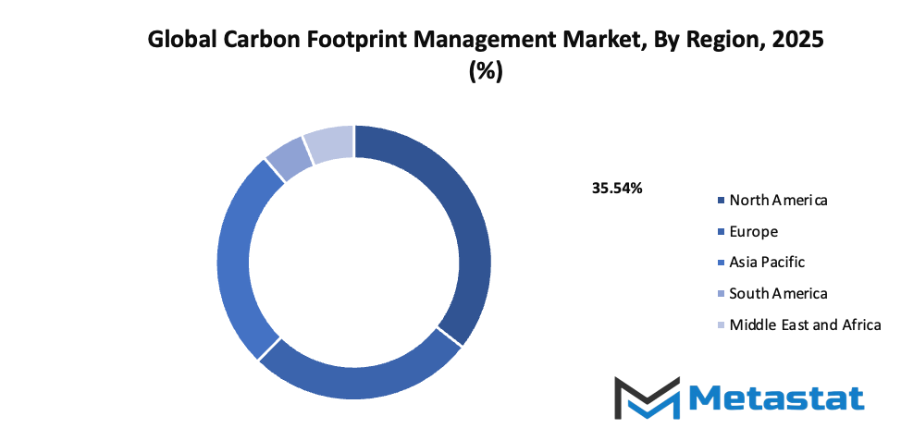
Based on geography, the global carbon footprint management market is divided into North America, Europe, Asia-Pacific, South America, and the Middle East & Africa.
North America is further divided into the U.S., Canada, and Mexico, whereas Europe consists of the UK, Germany, France, Italy, and the Rest of Europe.
Asia-Pacific is segmented into India, China, Japan, South Korea, and the Rest of Asia-Pacific.
The South America region includes Brazil, Argentina, and the Rest of South America, while the Middle East & Africa is categorized into GCC Countries, Egypt, South Africa, and the Rest of the Middle East & Africa.
Increasing regulatory pressure for emission reporting and reduction: Governments and regulatory authorities across the world are introducing stricter rules for monitoring and reducing emissions. Companies must comply with these regulations to avoid penalties, which will drive adoption of efficient carbon tracking and reporting systems, supporting the growth of the global carbon footprint management market.
Rising corporate commitment toward sustainability and net-zero targets: Businesses are showing stronger dedication toward sustainability and achieving net-zero emissions. This commitment will encourage investments in strategies and technologies that monitor, reduce, and report carbon emissions, positively influencing the expansion of the global carbon footprint management market.
High initial investment in carbon tracking and reduction technologies: Implementing systems to measure and lower carbon emissions requires significant upfront costs. These expenses can slow adoption despite long-term benefits, creating a barrier for smaller organizations, but large-scale initiatives will continue to fuel the global carbon footprint management market.
Lack of standardized measurement and reporting frameworks: Absence of uniform methods for tracking and reporting emissions creates confusion and inconsistency. This challenge makes it difficult for companies to compare performance, yet the development of consistent frameworks will gradually enhance efficiency in the global carbon footprint management market.
Growing adoption of digital tools and AI-based emission management platforms: Increasing use of digital technologies and AI platforms allows organizations to track and reduce emissions more efficiently. These innovations provide real-time insights, automate reporting, and optimize sustainability strategies, creating significant growth potential in the global carbon footprint management market.
The global carbon footprint management market will continue to grow as companies around the world place greater emphasis on environmental responsibility and regulatory compliance. The industry is a mix of both international industry leaders and emerging regional competitors. Important competitors include Locus Technologies, IBM Corporation, Schneider Electric, SAP SE, Deloitte, Salesforce, Wolters Kluwer N.V., Trinity Consultants, Ecometrica, Carbon Trust, Dakota Software, Thinkstep, EnergyCAP, Isometrix, Native, Carbon Footprint Ltd, and Intelex. Each of these companies offers a variety of tools and solutions designed to track, measure, and reduce carbon emissions across industries.
In the coming years, the industry will shift toward more advanced, technology-driven approaches. Artificial intelligence, data analytics, and cloud-based platforms will allow companies to monitor carbon footprints in real time, identify inefficiencies, and implement sustainable practices more effectively. Companies that were once considered regional players are likely to expand internationally, using innovative solutions to compete with established leaders. This trend will create a dynamic and competitive market where agility, innovation, and adaptability will define success.
Investments in renewable energy, sustainable supply chains, and eco-friendly processes will further accelerate demand for Carbon Footprint Management solutions. Companies will increasingly integrate these tools into their core operations, using them not only for regulatory reporting but also for strategic planning and brand differentiation. The growing importance of environmental, social, and governance (ESG) standards will drive organizations to adopt comprehensive carbon tracking systems.
The market’s future will also see more collaboration between industry leaders and smaller innovators. Partnerships and acquisitions will allow companies to combine global reach with specialized expertise, resulting in more efficient and scalable solutions. With the adoption of smart technologies, predictive modeling, and automation, the management of carbon emissions will become more precise, transparent, and actionable.
Market size is forecast to rise from USD 15.3 Billion in 2025 to over USD 55.2 Billion by 2032. Carbon Footprint Management will maintain dominance but face growing competition from emerging formats.
Overall, the global carbon footprint management market will evolve into a space where technology, innovation, and sustainability converge. Leaders and new entrants alike will need to continuously adapt to changing regulations, customer expectations, and environmental challenges. Companies that embrace these changes early will have the advantage, positioning themselves as both responsible and forward-thinking players in a market that will only become more critical to global business and environmental strategy.
This research report categorizes the Carbon Footprint Management market based on various segments and regions, forecasts revenue growth, and analyzes trends in each submarket. The report analyses the key growth drivers, opportunities, and challenges influencing the Carbon Footprint Management market. Recent market developments and competitive strategies such as expansion, type launch, development, partnership, merger, and acquisition have been included to draw the competitive landscape in the market. The report strategically identifies and profiles the key market players and analyses their core competencies in each sub-segment of the Carbon Footprint Management market.
Find answers to common questions about this report
Global Carbon Footprint Management market is valued at $15.3 Billion in 2025.
Global Carbon Footprint Management market is estimated to grow with a CAGR of 20.1% from 2025 to 2032.
Global Carbon Footprint Management market is estimated to reach $55.2 Billion by 2032.
Top players operating in the Carbon Footprint Management industry includes Locus Technologies, IBM Corporation, Schneider Electric, SAP SE, Deloitte, and Others.
The analysts below cover Energy and Power research at Metastat Insights.
LEAD ANALYST
Utkarsh Khirodkar is a Lead Market Research Analyst at MetaStat Insight, specializing in market intelligence, technology sector assessments, and competitive strategy.

PRINCIPAL CONSULTANT - ENTERPRISE AI & EMERGING TECHNOLOGIES
Banking & Finance · Electronics and Semiconductor · Energy and Power · Healthcare IT · Information & Technology · Professional Services
Vijay Gunti is a Principal Consultant at MetaStat Insight, bringing over two decades of experience across enterprise digital transformation, technology strategy, and intelligent systems.

ENERGY & INFRASTRUCTURE INDUSTRY CONSULTANT
Automotive and Transportation · Electronics and Semiconductor · Energy and Power · Machinery & Equipment
Saurabh Vasant Ganvir consults for Energy & Infrastructure Industry at MetaStat Insight, specializing in renewable energy, solar EPC, and electric vehicle (EV) infrastructure markets.
Evaluating sovereign cloud deployments for core banking platforms demands a clear view of data residency regulations and migration exit strategies. MetaStat Insight delivered an exhaustive review of regional latency tolerances, mainframe decommission milestones, and third-party vendor concentration risk. The regulatory compliance mapping across European and Asian financial jurisdictions gave our team a dependable baseline for multi-cloud infrastructure discussions.
Replacing petrochemical surfactants with bio-based alternatives requires realistic timelines on industrial precision fermentation scaling. The market research broke down commercialization timelines, feedstock sugar price sensitivities, and regional cosmetic ingredient regulatory approvals in Europe and East Asia. That supplier readiness mapping gave our formulations team reliable context when comparing renewable chemical sourcing roadmaps.
Tracking ceramic matrix composite adoption in high-bypass aero engines requires strict attention to material qualification cycles and FAA airworthiness testing milestones. The MetaStat Insight team provided a detailed timeline of silicon carbide fiber manufacturing capacity and commercial foundry lead times. Having clear visibility into upstream thermal barrier coating supply helped us stress-test our long-term component procurement strategy.
Explore related market intelligence reports worth reading alongside this one.