
LEAD ANALYST
Utkarsh Khirodkar is a Lead Market Research Analyst at MetaStat Insight, specializing in market intelligence, technology sector assessments, and competitive strategy.

Global LNG Market Size, Share, By Infrastructure (Liquefied Natural Gas (LNG) Liquefaction Plants, Liquefied Natural Gas (LNG) Regasification Facilities, Liquefied Natural Gas (LNG) Shipping), By Scale (Large-Scale (Above 5 mtpa), Mid-Scale (1 to 5 mtpa), Small-Scale (Below 1 mtpa)), By Location (Onshore, Offshore (FLNG and FSRU)), By End-Use Sector (Power Generation, Industrial Fuel and Feedstock, Residential and Commercial Gas Supply, Marine Transportation, Road Transportation, Others (Rail Transportation, Mining Vehicles)), Industry Analysis, Growth, Trends, and Forecast, 2026-2033
Report ID
MSI-3998
Published
October, 2026
Pages
304 Pages
Format
Historical
Base year
Forecast
Forecast period
Report Details
Market Valuation: Valued at $250.7 Billion in 2025, projected to reach $474.5 Billion by 2033 at a 8.3% CAGR.
Dominant Segment: The large-scale segment leads the market, primarily driven by the increasing demand for reliable energy supplies and the transition to cleaner energy sources.
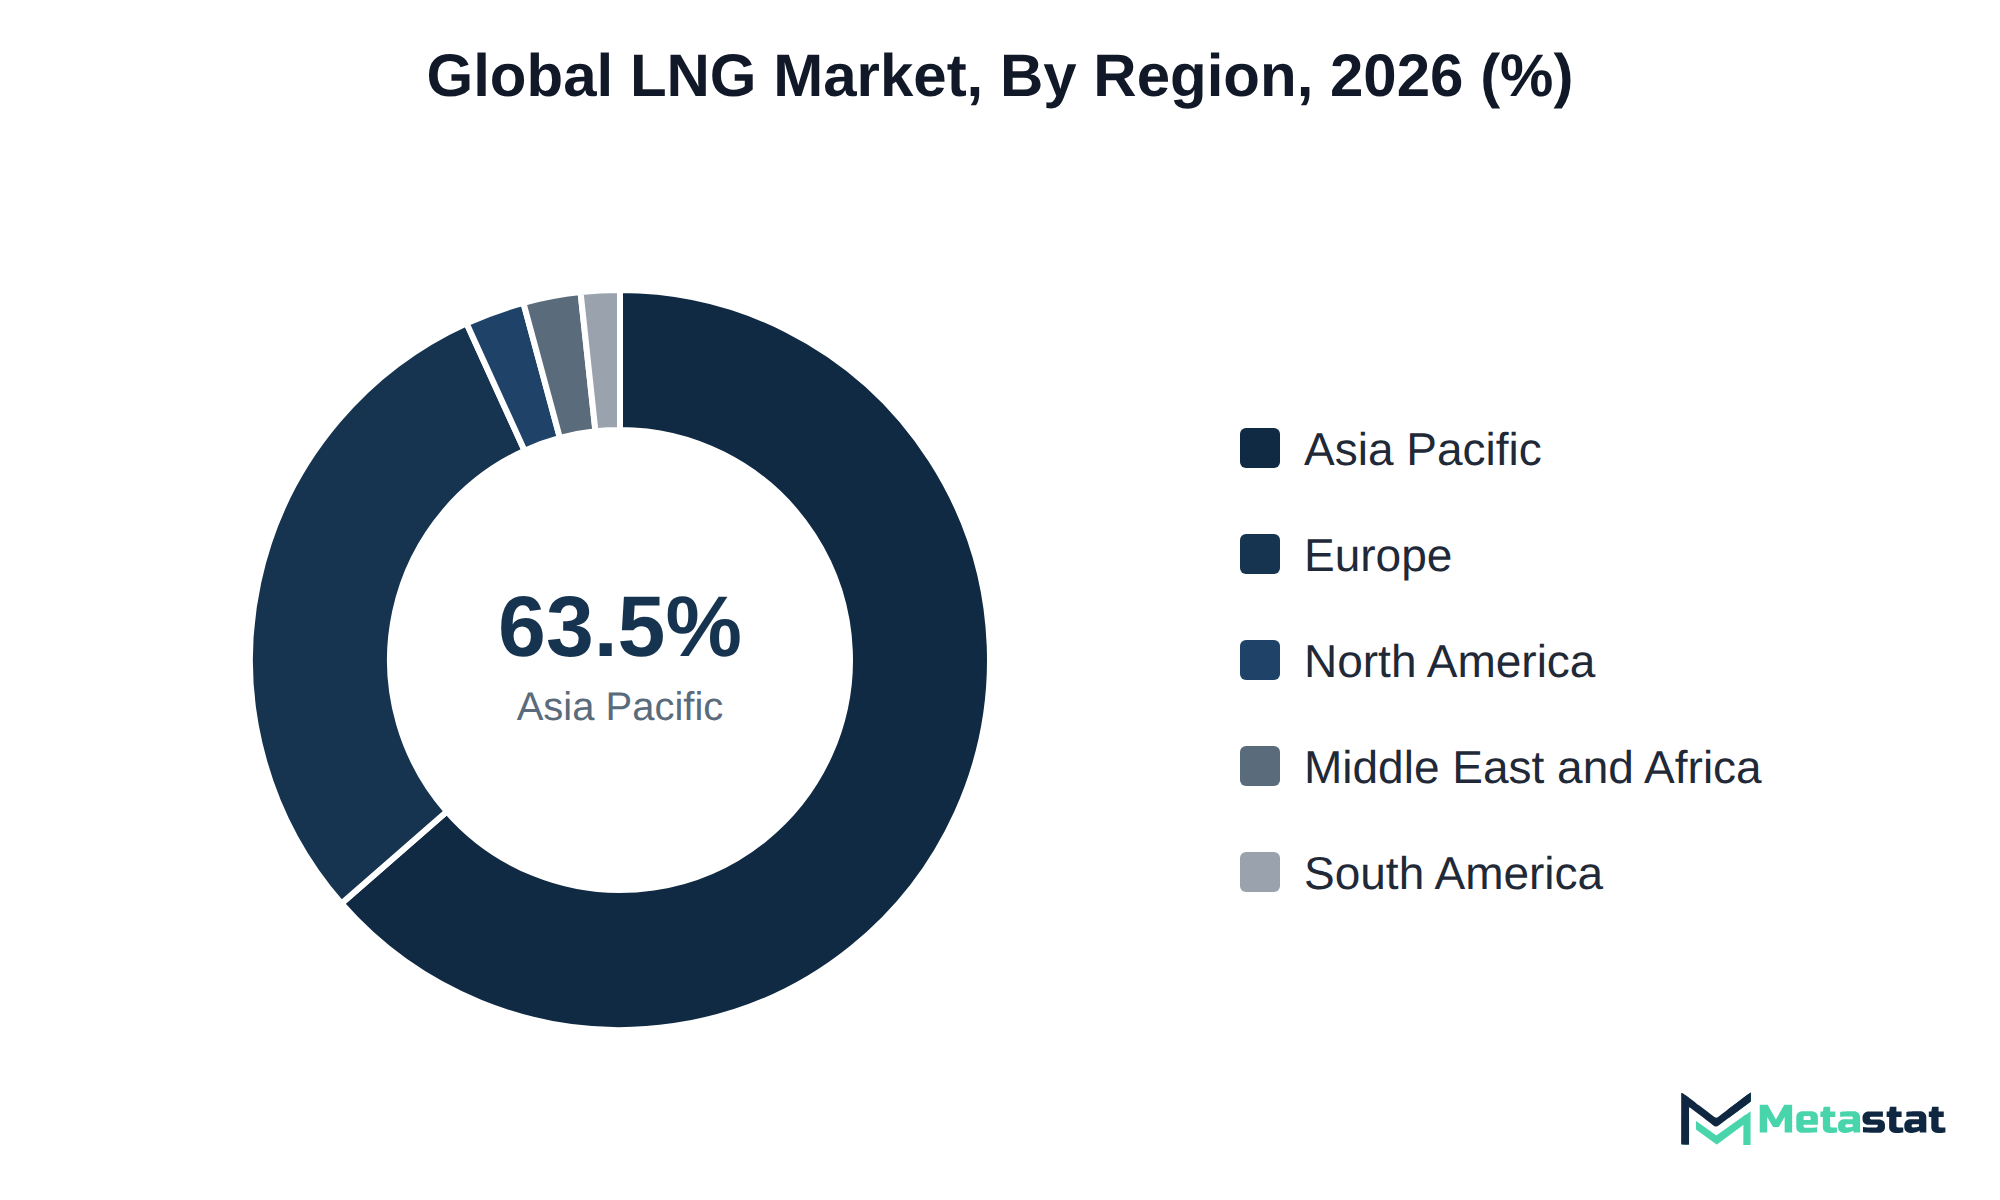
Geographic Lead: Asia Pacific holds the largest market share at 63.5%, bolstered by rapid industrialization and urbanization in major economies like China and India.
What's Inside: The report provides a comprehensive analysis of market segments, including infrastructure, scale, and end-use sectors, alongside competitive coverage and forecasts extending to 2033.
Growth Opportunities: The industrial fuel and feedstock segment is projected to grow at a CAGR of 8.5%, reflecting the rising demand for cleaner energy solutions across manufacturing sectors.
Emerging Trends: Technological advancements in LNG processing are enhancing efficiency and reducing operational costs, driving expansion and competitiveness in the market.
Choose Your License
Global LNG Market
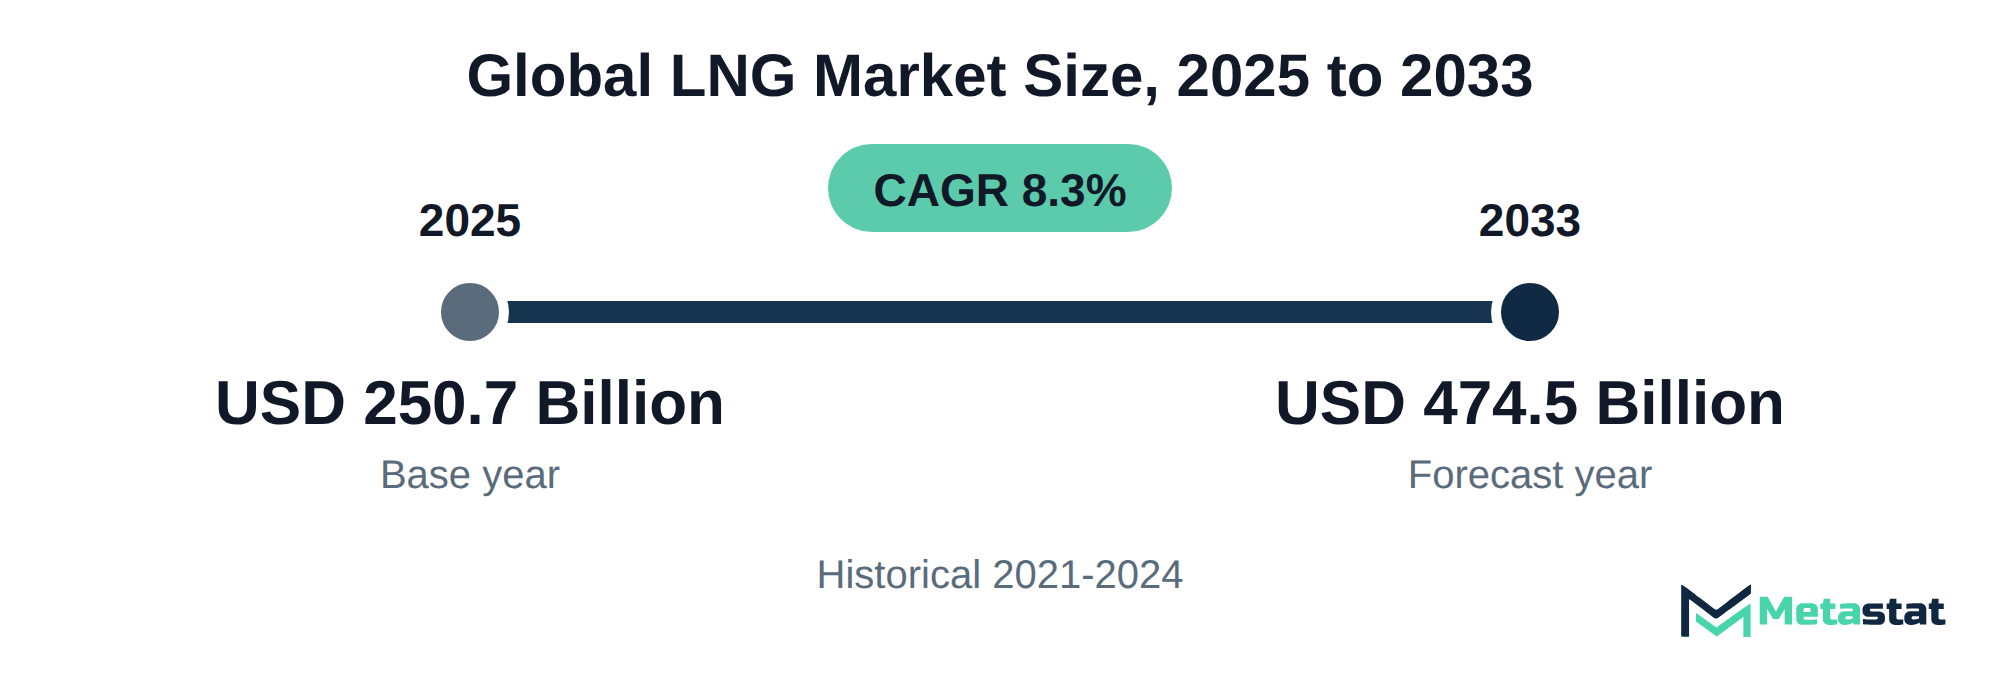
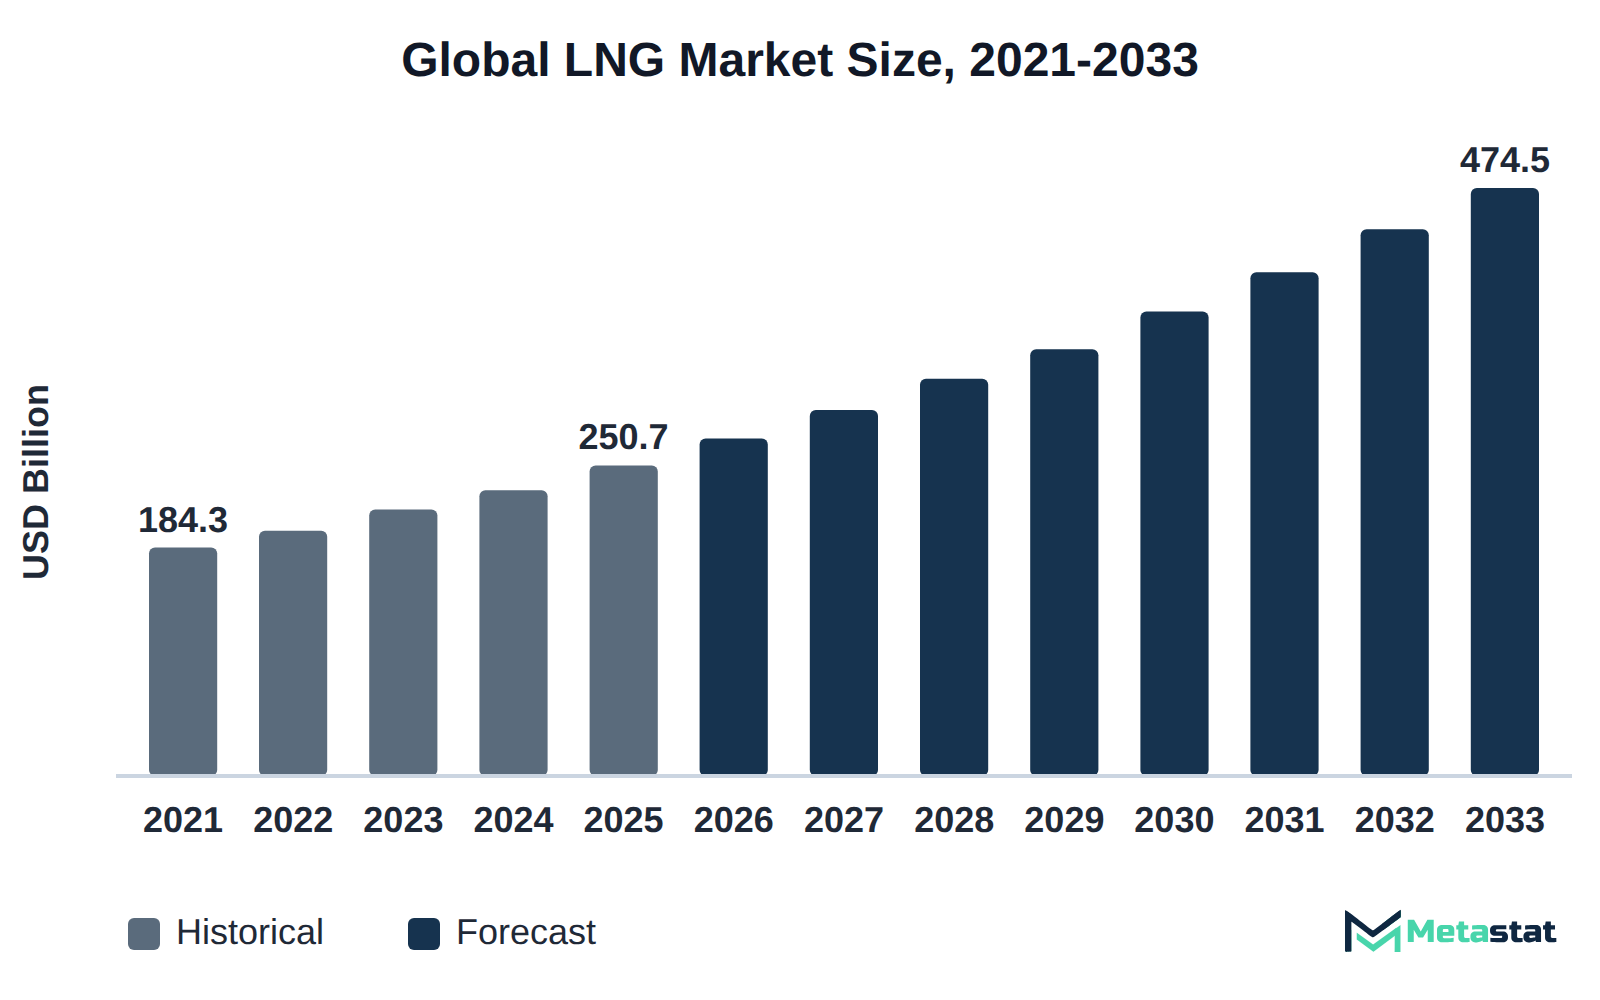
The global LNG market was valued at USD 250.7 billion in 2025 and is projected to reach USD 474.5 billion by 2033, growing at a CAGR of 8.3% over the forecast period.
The LNG market encompasses the production, transportation, and consumption of liquefied natural gas, a crucial energy source for various industries. Buyers invest in this market primarily due to the demand for cleaner energy alternatives and the need for reliable energy supply in power generation and industrial applications. The market serves diverse sectors, including power generation, industrial fuel and feedstock, and residential gas supply, reflecting a broad base of applications that drive purchasing decisions.
Growth in the market is driven by the increasing shift toward natural gas in energy generation, which offers lower emissions compared to traditional fossil fuels. The segment with the highest value is large-scale projects, which dominate overall production capacity. Asia Pacific leads in market share, accounting for 63.5%, driven by rapid industrialization and urbanization in major economies like China and India. North America holds 2.6% of the market in 2025, with the US leading in 2026.
Investments in LNG infrastructure, including liquefaction plants and regasification facilities, enhance capacity and efficiency, supporting market expansion. Anticipated growth in natural gas demand across sectors points to the importance of LNG in the shift toward more sustainable energy. With increasing focus on energy security and diversification of supply sources, the LNG market is positioned for significant development in the coming years.
The LNG market includes various segments including liquefaction plants, regasification facilities, and shipping operations, which support the energy needs of multiple sectors. Buyers invest in these segments driven by the demand for cleaner energy sources, which enhance energy security and reduce greenhouse gas emissions. Major industries, including power generation and industrial fuel, rely on LNG to meet their operational requirements, highlighting the significance of this energy source in their supply chains.
Growth in the market is primarily fueled by increasing demand for natural gas as a transition fuel in the energy sector. The large-scale segment, which encompasses facilities with capacities above 5 million tonnes per annum (mtpa), represents the most substantial share of the market's value. In terms of regional contributions, Asia Pacific holds the largest portion, accounting for 63.5% of the market, significantly outpacing other regions in terms of LNG consumption and investment.
The expansion of liquefaction capacity and the establishment of new regasification terminals enhance North America's market presence. The shift toward cleaner energy solutions supports continued LNG growth in the global energy market.
LNG liquefaction technology underpins growth in the LNG market. Investments in liquefaction capacity are rising, driven by the increasing need for natural gas as a cleaner energy source. Liquefaction plants use gas compressors in their refrigeration cycles. From 2026 to 2033, liquefaction plants are projected to expand from USD 158.1 billion to USD 286.9 billion, reflecting a compound annual growth rate (CAGR) of 8.9%. This expansion enables suppliers to meet the surging demand for LNG in regions including Asia Pacific, which commands a significant 63.5% share of the market.
Long-term supply contracts increasingly support this technological advancement. Buyers in power generation and industrial sectors seek stability in their energy supplies, prompting suppliers to establish more contracts that secure large volumes over extended periods. These contracts enhance the reliability of supply, which is essential given the fluctuating prices in global energy markets. A liquefaction strategy aligned with long-term contracts lets companies serve growing energy demand in developing regions, which leads to increased market profitability.
Floating LNG terminals provide a significant advantage in accessing import capacity due to their flexible deployment. These facilities enable countries to rapidly establish LNG supply chains without the extensive lead times associated with onshore facilities. By 2033, offshore floating liquefied natural gas (FLNG and FSRU) installations are expected to reach a value of USD 83.2 billion, reflecting an anticipated compound annual growth rate of 11.7%. This growth highlights the shift towards more adaptable energy sourcing solutions.
Pricing for LNG supplied via floating terminals differs from traditional contracts. Typically, contracts include both long-term agreements and spot market pricing, which fluctuates based on demand and supply dynamics. Long-term contracts often tie pricing to oil indices, while spot market transactions follow regional price benchmarks. This dual pricing structure influences procurement strategies among buyers, allowing them to balance cost stability with market responsiveness. The ability to deploy floating terminals for immediate supply significantly impacts purchasing strategies in the LNG market.
The increased accessibility of floating LNG infrastructure allows for faster response times to market changes. This adaptability enhances competitiveness for nations seeking energy security or diversifying their energy portfolio. Buyers benefit from the varied pricing models associated with floating terminals, allowing them to make strategic decisions aligned with market conditions.
LNG bunkering is experiencing significant growth, driven by the marine industry's shift towards cleaner fuels. The demand for LNG marine fuel is supported by an increasing number of international regulations aimed at reducing emissions from maritime activities. This trend aligns with a broader industry movement towards sustainable practices such as maritime decarbonization, creating a strong incentive for shipping companies to invest in LNG bunkering solutions.
Investment in LNG marine fuel infrastructure reflects this growing demand. The LNG shipping segment is projected to reach a value of USD 83.9 billion by 2033, highlighting the importance of expanding infrastructure to support this demand surge. Dedicated LNG bunkering facilities keep supply in line with the needs of the maritime sector and support operational efficiency and compliance with regulatory standards.
Investments in LNG bunkering infrastructure strengthen the competitive positioning of shipping firms by giving them access to cleaner fuel alternatives. This transition supports the industry's sustainability goals and positions stakeholders to benefit from anticipated growth in LNG demand across maritime applications.
The procurement costs of liquefied natural gas (LNG) significantly depend on oil-indexed contracts and spot prices, influencing buyer strategies in this evolving market. Spot prices have shown volatility, often diverging from long-term contracts indexed to oil prices. Oil indexation ties LNG procurement costs to the wider oil and gas industry. The global LNG market reached a value of USD 250.7 billion in 2025, reflecting a growing reliance on these contracts for price stability and predictability.
Buyers frequently weigh long-term contracts against fluctuating spot prices. For instance, the infrastructure segment, particularly liquefaction plants, is expected to grow from USD 158.1 billion in 2026 to USD 286.9 billion by 2033, indicating increasing investment in facilities that support stable procurement through contracts. The strategic choice between these procurement methods directly impacts operational costs, with long-term contracts typically offering fixed pricing, while spot purchases yield both savings and unexpected expenses driven by market fluctuations.
Ultimately, understanding the dynamics of oil-indexed contracts and spot prices enables buyers to make informed decisions, balancing risk and cost in their LNG procurement strategies. This awareness proves essential for optimizing expenditures and ensuring competitiveness in the market.
Increased environmental awareness drives industrial sectors to seek cleaner energy solutions, significantly impacting purchasing decisions. Key buyers, particularly in power generation and industrial fuel, shift focus toward liquefied natural gas (LNG) due to its lower carbon emissions compared to traditional fossil fuels. This transition reflects broader trends toward sustainability and compliance with tightening emissions standards. The LNG market experiences heightened demand, leading to greater investment in infrastructure and shipping capabilities. Projections indicate that power generation is expected to expand from USD 122.5 billion in 2026 to USD 204.9 billion by 2033, reflecting the anticipated growth within this sector. This transition supports the market’s overall expansion, highlighting the increasing importance of LNG in achieving energy efficiency and reducing carbon footprints.
The rise in cleaner energy adoption opens opportunities for technological advancements within the LNG market, further enhancing operational efficiencies.
Recent advancements in liquefied natural gas processing technology influence the market's growth trajectory. Enhanced liquefaction techniques improve efficiency and reduce operational costs, enticing new market entrants and current players to expand their capacities. Innovations in manufacturing processes, including modular liquefaction plants, streamline production, enabling facilities to adapt quickly to changing market demands and energy consumption patterns. Improvements in regasification technologies facilitate effective integration into existing energy infrastructure, increasing the attractiveness of LNG for power generation and industrial applications.
Growing interest in autonomous shipping solutions supports the expansion of LNG shipping capabilities, reducing transportation costs and enhancing supply chain efficiency. These developments increase the competitiveness of LNG against alternative energy sources. More suppliers enter the market because technological efficiencies raise profit potential, which encourages investment and market growth. Overall, these technological advancements shape the strategic direction of the LNG market.
Fluctuating prices of liquefied natural gas (LNG) significantly impact investment decisions among buyers, particularly in the industrial and power generation sectors. High and unpredictable costs create hesitation among companies considering new projects or expansions. This reluctance often results in delayed procurement and smaller contract sizes, ultimately limiting the growth potential of the market. For instance, industries that rely heavily on LNG for power generation face challenges in budgeting and forecasting when prices vary dramatically. This instability affects both immediate purchasing decisions and long-term strategic planning. While companies pursue cost-effective energy solutions, price volatility of LNG deters them from committing to large-scale projects that require substantial upfront investment. Consequently, the market experiences slower adoption rates, hindering its overall development and growth trajectory.
Increased input costs create significant pressure on profit margins within the market. Suppliers face heightened expenses related to the procurement of raw materials and operational inputs, leading to challenges in maintaining competitive pricing. The rise in demand for liquefied natural gas (LNG) pushes suppliers to optimize their operations to mitigate these rising costs while ensuring profitability.
To address these challenges, suppliers invest in innovative technologies and streamline their operational processes. Many firms explore strategic partnerships to enhance efficiencies and share resources, which leads to cost reductions. Several suppliers reconsider their pricing strategies to remain competitive in a market characterized by fluctuating demand and input costs. These adaptations are essential for sustaining growth in a competitive landscape, ultimately influencing the overall profitability of the LNG market.
Industrial fuel and feedstock presents a notable opportunity within the LNG market, with a projected compound annual growth rate (CAGR) of 8.5% through to 2033. This growth stems from increased industrialization and the need for cleaner energy sources across manufacturing sectors. The demand for LNG in this context highlights a shift towards sustainable fuel options, driven by stringent emissions regulations and operational efficiency requirements within industries. The segment's growth reflects a broader trend of industries transitioning to liquefied natural gas, enhancing their environmental credentials while maintaining energy reliability. While the market expands, investments in regasification facilities and shipping infrastructure will likely play a critical role in meeting this rising demand. The anticipated growth in LNG supply chain capabilities correlates directly with the increasing utilization of LNG in industrial applications, confirming a positive trajectory for the market.
The Global LNG market is segmented based on Infrastructure, Scale, Location, and End-Use Sector.
Liquefied Natural Gas (LNG) Liquefaction Plants segment is valued at USD 158.1 billion in 2026 and is projected to reach USD 286.9 billion by 2033, at a CAGR of 8.9% during the forecast period. These plants serve critical functions for the conversion of natural gas into liquid form, allowing for efficient storage and transportation. Major industries using this segment include power generation, petrochemicals, and industrial processes. Demand for liquefaction plants is driven by the increasing need for energy security and the shift towards cleaner energy sources. Compared to other segments, this sub-segment exhibits a higher growth rate, fueled by advancements in liquefaction technology and expanding global energy demand. With a CAGR of 8.9%, this segment outpaces LNG regasification facilities, which grow at a CAGR of 7.3%. The capacity to meet rising energy demands highlights the strategic importance of this segment within the LNG market.
Liquefied Natural Gas (LNG) Regasification Facilities segment is estimated to reach USD 103.6 billion by 2033, at a CAGR of 7.3% during the forecast period. These facilities convert LNG back into its gaseous state for distribution and utilization, serving primarily power generation and industrial sectors. The rapid adoption of LNG for cleaner energy solutions drives demand for regasification facilities, particularly in regions transitioning from coal and oil. This segment exhibits slower growth compared to others, including LNG Liquefaction Plants, which has a CAGR of 8.9%. Growing focus on energy security and stability in pricing influences investments in regasification, emphasizing the necessity for infrastructure that accommodates increased LNG imports. Enhanced regulatory frameworks and government incentives for cleaner energy sources continue to support this segment's expansion, positioning it as a critical component of the overall LNG market.
Liquefied Natural Gas (LNG) Shipping segment is expected to reach USD 83.9 billion by 2033. This segment focuses on the transportation of LNG from production facilities to end-users, including power generation and industrial sectors. Operators including shipping companies and energy firms rely on LNG shipping for efficient delivery of energy supplies. An increase in global energy demand drives the growth of this segment, particularly in regions like Asia Pacific, which holds a significant market share. Compared to other segments, LNG shipping experiences a moderate growth rate, reflecting a compound annual growth rate (CAGR) of 8.3%. The segment's growth is influenced by the strategic expansion of liquefaction and regasification facilities, enhancing supply chain connectivity. This growth trajectory presents opportunities for investment in new fleet technologies and infrastructure, ensuring the efficient movement of LNG within an evolving energy landscape.
Large-Scale (Above 5 mtpa) segment is valued at USD 212.8 billion in 2026 and is projected to reach USD 362.6 billion by 2033, at a CAGR of 7.9% during the forecast period. This segment primarily serves large-scale buyers including utilities and major industrial consumers. Demand remains strong due to the growing need for reliable energy supplies and the transition to cleaner energy sources. The increasing focus on energy security fuels investment in large-scale liquefaction projects, significantly impacting capacity expansion. Compared to mid-scale and small-scale segments, large-scale production offers lower operational costs per unit, enhancing competitiveness. This segment's growth rate is slower than that of mid-scale production, which experiences a CAGR of 9%. The financial implications of large-scale projects are substantial, often requiring significant initial capital investment while yielding substantial long-term returns for stakeholders and enhancing overall market stability.
Mid-Scale (1 to 5 mtpa) segment is estimated to reach USD 82.1 billion by 2033, at a CAGR of 9% during the forecast period. This segment primarily serves industrial clients who require flexible solutions to meet their energy needs. Driven by the growing demand for cleaner energy alternatives, the segment experiences robust interest among companies focused on carbon footprint management. Compared to large-scale projects, this segment tends to be more agile, accommodating various scales of operation, which attracts a diverse set of buyers. The Mid-Scale segment differentiates itself by promising faster growth relative to Large-Scale (Above 5 mtpa) projects, which are projected to achieve a CAGR of 7.9%. The market's emphasis on flexibility and adaptability positions this sub-segment favorably amid fluctuating economic conditions.
Small-Scale (Below 1 mtpa) segment is expected to reach USD 29.8 billion by 2033. This segment caters to localized markets, providing LNG solutions for smaller consumers, including residential, commercial, and niche industrial applications. Increased demand for cleaner energy sources enhances growth in this segment, particularly among regions and customers focusing on sustainability. The segment experiences a compound annual growth rate (CAGR) of 9%, which outpaces the larger scale counterparts. Flexibility in deployment and lower capital investment requirements differentiate this sub-segment from larger-scale operations, appealing to a diverse range of buyers who do not require bulk quantities. Adoption barriers remain minimal, with technological advancements in small-scale liquefaction and regasification enabling faster project implementation. The LNG market benefits from this sub-segment by expanding its reach to underserved areas, ultimately contributing to overall market growth and diversification.
The onshore segment is valued at USD 233.8 billion in 2026 and is projected to reach USD 391.3 billion by 2033, at a CAGR of 7.6% during the forecast period. This segment primarily caters to power generation and industrial applications, making it essential for utilities and large-scale manufacturers. The rising demand for cleaner energy solutions continues to advance this segment. Increased investments in infrastructure and the expansion of LNG supply chains support its growth. Compared to offshore alternatives, the onshore segment exhibits slower growth due to higher capital expenditures associated with land-based projects. Pricing dynamics shape buyer behavior, and onshore facilities typically incur lower operational costs, which makes them more attractive to certain buyers. This characteristic differentiates it from offshore facilities, which experience faster growth driven by technological advancements.
Offshore LNG facilities, including FLNG and FSRU units, support natural gas extraction and processing at sea, serving industries reliant on energy supply, particularly in regions lacking extensive pipeline infrastructure. Growth in this segment is driven by increasing demand for cleaner energy solutions, particularly in markets including Europe and Asia Pacific, where environmental regulations intensify. Compared to other segments, this category experiences faster growth due to its innovative technology and flexibility, appealing to operators seeking to utilize offshore resources efficiently. The unique positioning of offshore facilities allows for reduced reliance on land-based infrastructure, contributing to their competitive advantage in the LNG market. As energy markets evolve, the offshore segment is expected to continue attracting investments, reinforcing its significance in the broader energy landscape.
Power Generation segment is valued at USD 122.5 billion in 2026 and is projected to reach USD 204.9 billion by 2033, at a CAGR of 7.6% during the forecast period. This segment produces electricity for various sectors, including residential, commercial, and industrial applications. The transition towards cleaner energy sources drives demand for liquefied natural gas (LNG) in power generation, particularly from countries focused on reducing carbon emissions and enhancing energy security. This segment experiences growth at a notable rate compared to others, including Industrial Fuel and Feedstock, which is projected to grow at a CAGR of 8.5%. Favorable pricing dynamics of LNG relative to other fossil fuels enhance its attractiveness for power producers, influencing their energy sourcing strategies. Increasing adoption of LNG-fired power plants highlights a shift in the market towards more efficient and environmentally friendly energy solutions. LNG-fired plants commonly generate electricity with gas turbine technology.
Industrial Fuel and Feedstock segment is estimated to reach USD 145.9 billion by 2033, at a CAGR of 8.5% during the forecast period. This segment serves various industries, particularly those involved in manufacturing and processing, where LNG acts as a vital energy source and feedstock. Increasing emphasis on cleaner fuel alternatives drives significant demand, particularly from industrial buyers aiming to reduce their carbon footprint. The segment exhibits a growth trajectory that stands out compared to others in the End-Use Sector, reflecting a higher CAGR than Power Generation at 7.6%. Regulatory frameworks promoting emissions reductions, along with technological advancements, support this growth by enhancing operational efficiencies. The segment's rise contrasts with challenges faced in segments including Marine Transportation, which experiences different dynamics impacting its adoption and pricing. The LNG market's focus on industrial applications highlights its strategic importance in global energy transitions.
Residential and Commercial Gas Supply segment is expected to reach USD 81.4 billion by 2033. This segment primarily serves households and businesses for heating, cooking, and other energy needs. One significant driver for growth involves increasing demand for cleaner and more efficient energy sources, reflecting the transition toward sustainable energy solutions. This segment grows more slowly than the Marine Transportation segment, which has a CAGR of 14.9%. The projected CAGR of 8.5% highlights ongoing evolution in consumer preferences and the urgency to reduce carbon footprints, driving investments in LNG infrastructure. Enhanced regulatory support for cleaner energy options further influences the market, ensuring steady demand for residential and commercial applications while differentiating it from sectors like Power Generation that face more rapid growth.
Marine Transportation segment is projected to grow at a CAGR of 14.9% during the forecast period. This segment focuses on the transportation of liquefied natural gas through specialized vessels, catering to global market demand from regions with increasing energy requirements. Major players in this field include shipping companies and logistics providers that strategically align their operations to meet the evolving energy landscape. Demand for marine transportation experiences an upward trend due to the rising need for cleaner fuel alternatives, particularly in Asia Pacific, where energy consumption is surging. Compared to other segments, marine transportation experiences a faster growth rate, driven by expanding global trade and a shift towards sustainable energy sources. The segment's unique characteristics, including operational costs and technological advancements in shipping, differentiate it from traditional land-based logistics, highlighting its significance in the LNG market.
Road Transportation involves the use of LNG as a fuel source for heavy-duty trucks and buses. This segment appeals to fleet operators and public transportation agencies seeking alternatives to traditional diesel fuels, driven by a focus on reducing greenhouse gas emissions and enhancing fuel efficiency. Increasing regulatory pressure on emissions standards reinforces the transition to LNG, positioning it as a cleaner alternative. Comparatively, this segment experiences slower growth compared to other end-use sectors, including Power Generation, due to higher infrastructure costs associated with LNG fueling stations. Adoption barriers include the initial investment required for refueling infrastructure and limited availability of LNG vehicles. Despite these challenges, the push for sustainable transportation solutions within the LNG market drives interest and investment in this segment.
Rail transportation and mining vehicles use liquefied natural gas (LNG) to enhance operational efficiency and reduce emissions. These applications target sectors focused on sustainable practices, where the transition to cleaner fuels aligns with regulatory mandates and corporate sustainability goals. Demand for LNG in these areas increases due to the growing emphasis on environmental responsibility and cost-effective fuel alternatives. Unlike other segments, this sub-segment faces distinct adoption barriers related to infrastructure and vehicle compatibility, which slow growth compared to sectors like power generation. However, technological advancements in fuel systems and rising environmental regulations contribute to a gradual increase in interest and investment in LNG applications for rail and mining vehicles. This evolution reflects a proactive approach from industries seeking to integrate cleaner energy sources into traditional operational frameworks, positioning the LNG market for enhanced relevance in various transport sectors.
Based on geography, the Global LNG market is divided into North America, Europe, Asia-Pacific, South America, Middle East, and Africa.
Demand for liquefied natural gas in North America is driven by various industrial sectors, particularly power generation and industrial fuel applications. The United States, Canada, and Mexico exhibit increasing investments in liquefaction and regasification facilities, enhancing regional infrastructure capabilities. These facilities support domestic consumption and export strategies, addressing rising energy demands and facilitating energy transition initiatives. North America is projected to reach USD 14.8 billion by the end of 2033. The market's growth reflects a commitment to reliability and sustainability, with significant upgrades to existing facilities. Incentives for cleaner energy solutions continue to play a role in shaping the market. Regional developments align with broader trends in energy security and environmental sustainability, positioning North America as an influential player in the global LNG market.
LNG market demand in Europe is driven by several factors, including the power generation and industrial fuel sectors. Countries including Germany and France focus on transitioning to cleaner energy sources, prompting investments in LNG infrastructure. The European Union's commitment to reducing carbon emissions creates a favorable environment for LNG adoption, particularly in power generation applications. Russia's supply dynamics influence market stability and pricing. With a projected 29.6% share of the global market in 2025, Europe holds a significant position in the changing energy landscape. Ongoing investments in regasification facilities and liquefaction plants support this growth, signaling a strong future for the LNG market in the region.
Asia Pacific stands out in the LNG market, commanding a 63.5% share in 2025. The region's demand is driven primarily by large-scale industries in China, Japan, and India, which rely heavily on LNG for power generation and industrial fuel. Rapid urbanization and industrialization across Southeast Asia further support this demand, creating a robust market environment. Investments in LNG infrastructure, including liquefaction plants and regasification facilities, enhance the region's capabilities to meet rising energy needs. The competitive landscape features major players including Cheniere Energy, Exxon Mobil Corporation, and QatarEnergy, each contributing to the market's growth trajectory. The LNG market in Asia Pacific is anticipated to experience sustained growth, fueled by increasing energy consumption and ongoing efforts to transition to cleaner energy sources.
In South America, significant growth in the LNG market stems from increasing energy demands, particularly in Brazil and Argentina. The region's energy landscape is shaped by investments in LNG infrastructure, which support power generation and industrial applications. Brazil's focus on expanding its LNG import capacity reflects national efforts to enhance energy security and diversification. With a projected market share of 1.7% in 2025, South America contributes significantly to the global LNG landscape. Local industries increasingly recognize the economic benefits of switching to LNG, a cleaner alternative to traditional fuels. Overall, the response to environmental regulations and the pursuit of more sustainable energy sources drive demand for liquefied natural gas in this region.
The Middle East and Africa exhibit unique dynamics within the LNG market, driven by domestic industrial growth and increasing energy demands. Countries including Saudi Arabia and the UAE invest heavily in LNG infrastructure, supporting their transition to cleaner energy sources. Notable developments include the expansion of liquefaction and regasification facilities, which enhance regional supply capabilities. South Africa represents another emerging market, focusing on LNG imports to meet its energy needs. The region's share of the global market stands at 2.5% in 2025, reflecting its developing role in the LNG sector. Competitive pricing and favorable investment climates are expected to attract further investment, facilitating market growth.
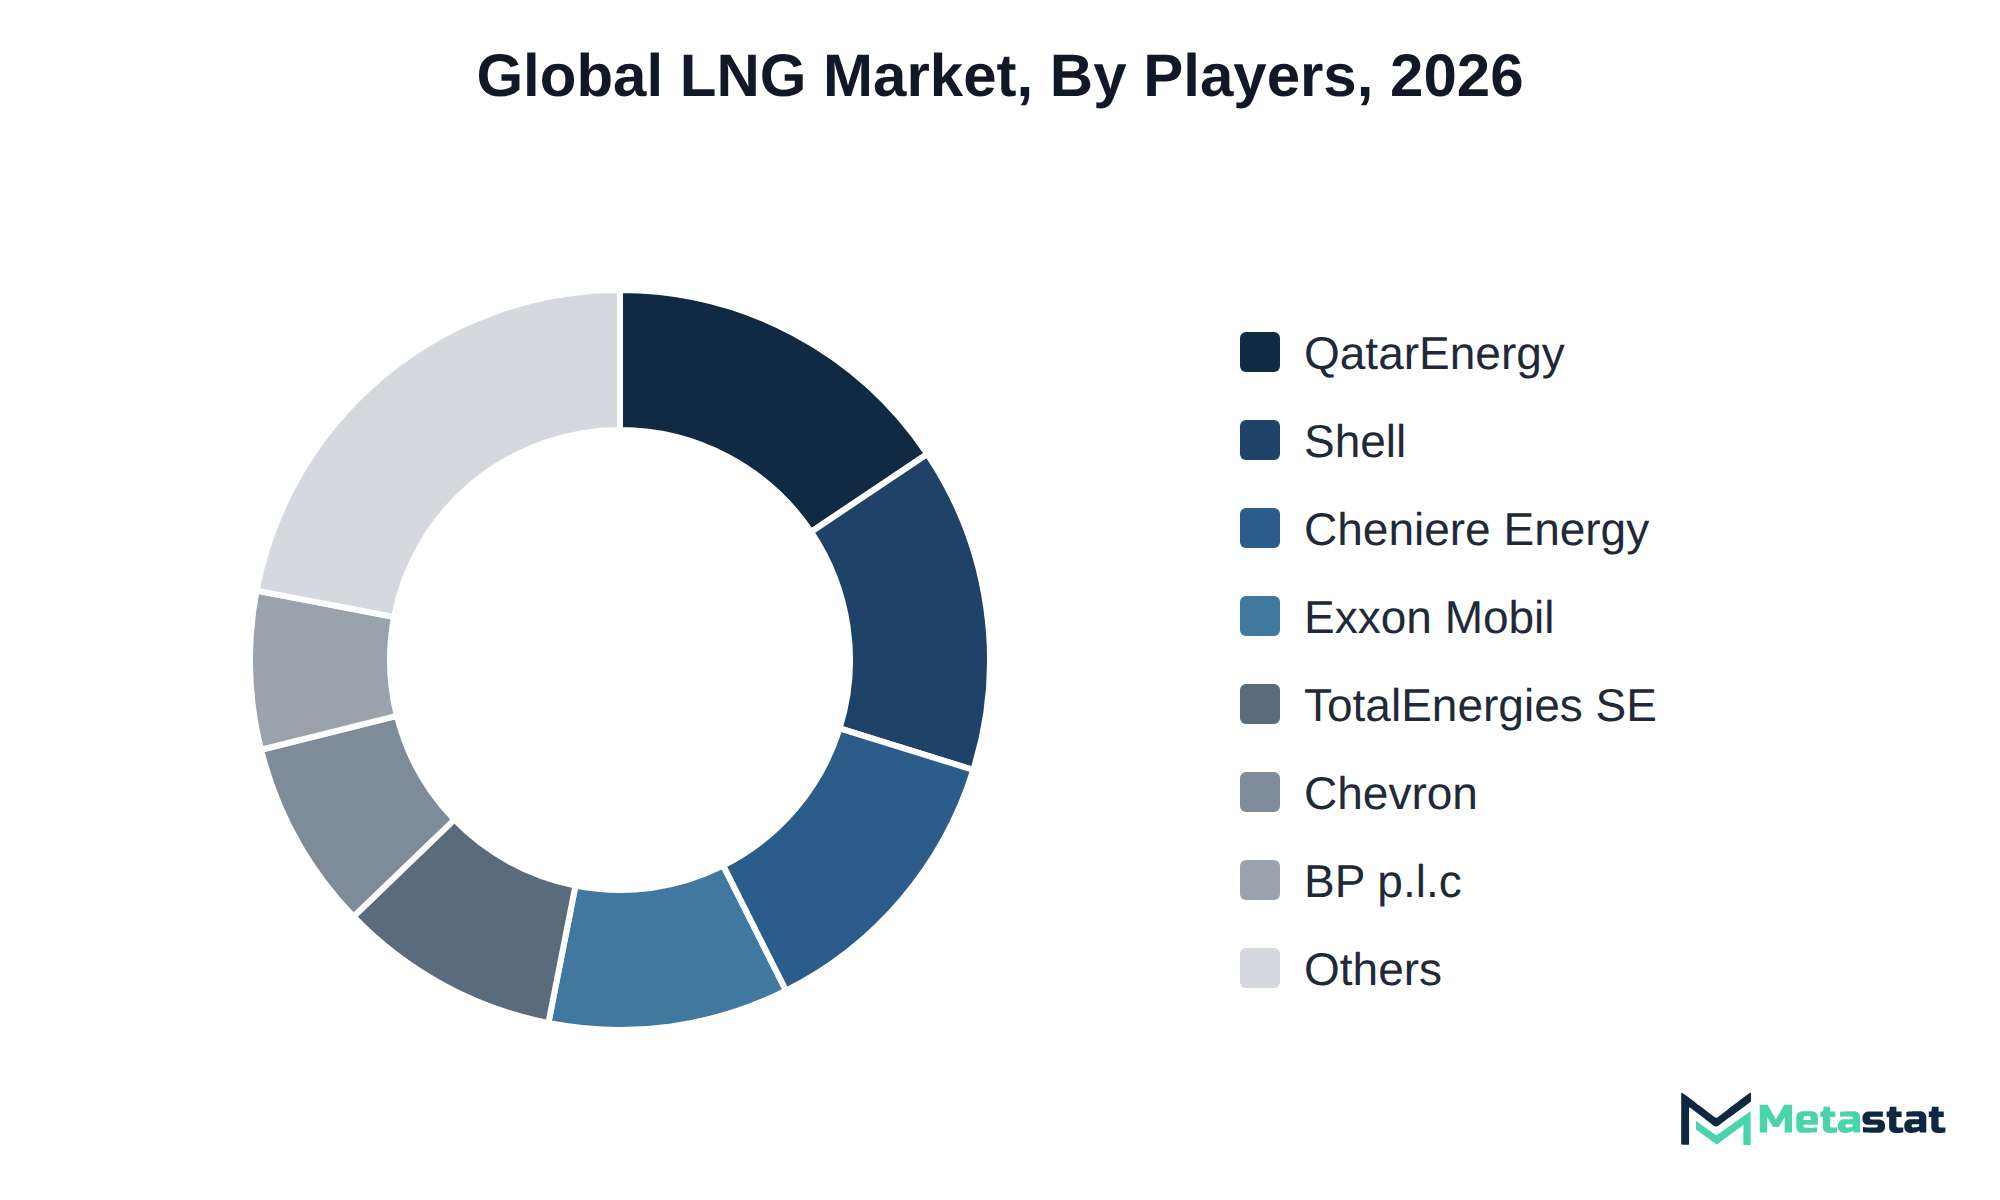
Companies in the LNG market differentiate themselves through various strategies, including pricing, certification, and service offerings. The market features a mix of operators focusing on large-scale liquefaction and regasification facilities, small-scale solutions, and shipping capabilities. Major players including Shell plc and QatarEnergy prioritize robust infrastructure development and operational efficiency to meet rising demand for LNG.
Buyers in the LNG market weigh options based on price, customization, and the overall service ecosystem. For instance, Cheniere Energy, Inc. focuses on large-scale LNG exports, while TotalEnergies SE emphasizes sustainable and low-carbon solutions. Companies like BP p.l.c. and Exxon Mobil Corporation invest in diverse LNG projects to enhance their market position and cater to varying customer needs for liquefied natural gas.
Achieving the projected LNG market growth relies on several key developments. A significant increase in large-scale liquefied natural gas (LNG) liquefaction plants will drive production capabilities, supporting the growing demand from the Asia Pacific region, which is expected to maintain the largest market share. Expansion of LNG regasification facilities will enhance distribution networks, facilitating greater access for industrial fuel and feedstock applications, particularly in Europe where demand for cleaner energy sources continues to rise.
One main risk that could inhibit this growth involves regulatory challenges and geopolitical tensions affecting supply chains. Disruptions in regions including the Middle East and Africa lead to fluctuations in supply, impacting overall market stability. Together, these developments and risks make the outlook for the LNG market to 2033 complex, and they call for strong infrastructure and strategic partnerships to manage potential challenges.
By Infrastructure: Liquefied Natural Gas (LNG) Liquefaction Plants, Liquefied Natural Gas (LNG) Regasification Facilities, Liquefied Natural Gas (LNG) Shipping
By Location: Onshore, Offshore (FLNG and FSRU)
By End-Use Sector: Power Generation, Industrial Fuel and Feedstock, Residential and Commercial Gas Supply, Marine Transportation, Road Transportation, Others (Rail Transportation, Mining Vehicles)
The report strategically identifies and profiles the key market players and analyses their core competencies in each sub-segment of the LNG market.
|
Report Attributes |
Details |
|
Study Period |
2021-2033 |
|
Base Year |
2025 |
|
Estimated Year |
2026 |
|
Forecast Period |
2026-2033 |
|
Historical Period |
2021-2025 |
|
Growth Rate |
CAGR 8.3% from 2026 to 2033 |
|
Revenue Unit |
USD billion |
|
Segmentation |
By Infrastructure, Scale, Location, End-Use Sector, and Region |
|
By Region |
North America (By Infrastructure, Scale, Location, End-Use Sector, and Country)
|
|
Europe (By Infrastructure, Scale, Location, End-Use Sector, and Country)
|
|
|
Asia Pacific (By Infrastructure, Scale, Location, End-Use Sector, and Country)
|
|
|
South America (By Infrastructure, Scale, Location, End-Use Sector, and Country)
|
|
|
Middle East and Africa (By Infrastructure, Scale, Location, End-Use Sector, and Country)
|
Find answers to common questions about this report
The LNG market size was valued at USD 250.7 billion in 2025.
The market is projected to grow at a CAGR of 8.3% during the forecast period from 2026 to 2033.
The North America LNG market size is estimated to reach USD 14.8 billion by 2033.
The leading segment in the LNG market is Liquefied Natural Gas (LNG) Liquefaction Plants, with a projected value of USD 286.9 billion by 2033. This segment outpaces others in terms of growth and revenue potential.
Key drivers for the LNG market include increased environmental awareness, prompting industrial sectors to seek cleaner energy solutions. The demand for liquefied natural gas in industrial fuel and feedstock reflects a shift toward sustainable fuel options, driven by stringent emissions regulations and operational efficiency requirements.
Asia Pacific holds the dominant share of the LNG market, accounting for 63.5% of the total market. This significant share reflects the region's extensive demand and infrastructure development.
Increased industrialization and stringent emissions regulations favor the adoption of LNG as a cleaner energy source across manufacturing sectors. This shift toward sustainable fuel options reflects the industry's commitment to operational efficiency and environmental responsibility, supporting a projected compound annual growth rate of 8.5% through to 2033.
The LNG market is estimated to reach a valuation of USD 474.5 billion by 2033.
Key players operating in the LNG industry include Shell plc, QatarEnergy, TotalEnergies SE, Cheniere Energy, Inc., Exxon Mobil Corporation, Chevron Corporation, and BP p.l.c..
LNG shipping is projected to reach USD 83.9 billion by 2033, reflecting the growing demand for liquefied natural gas transportation.
The analysts below cover Energy and Power research at Metastat Insights.
LEAD ANALYST
Utkarsh Khirodkar is a Lead Market Research Analyst at MetaStat Insight, specializing in market intelligence, technology sector assessments, and competitive strategy.

PRINCIPAL CONSULTANT - ENTERPRISE AI & EMERGING TECHNOLOGIES
Banking & Finance · Electronics and Semiconductor · Energy and Power · Healthcare IT · Information & Technology · Professional Services
Vijay Gunti is a Principal Consultant at MetaStat Insight, bringing over two decades of experience across enterprise digital transformation, technology strategy, and intelligent systems.

ENERGY & INFRASTRUCTURE INDUSTRY CONSULTANT
Automotive and Transportation · Electronics and Semiconductor · Energy and Power · Machinery & Equipment
Saurabh Vasant Ganvir consults for Energy & Infrastructure Industry at MetaStat Insight, specializing in renewable energy, solar EPC, and electric vehicle (EV) infrastructure markets.
Assessing 200mm wafer transition schedules and substrate supply bottlenecks requires precise technical intelligence. MetaStat Insight supplied an actionable breakdown comparing planar and trench MOSFET architectures across automotive and industrial drive markets. The regional capacity estimates for Asia-Pacific foundries helped clarify lead-time uncertainties during our strategic planning session. When we needed additional clarification on high-purity raw material sourcing, their analyst team responded with helpful context within twenty-four hours.
Tracking maintenance cycle demand for secondary flight display units and terrain collision avoidance systems across regional jet fleets involves complex aftermarket dynamics. MetaStat Insight provided practical analysis separating airline retrofit programs from OEM forward-fit production schedules in North America and Southeast Asia. The supplier matrix highlighted component obsolescence timelines without resorting to vague generalizations. The dataset served as a dependable reference during our annual program review meetings.
Evaluating secondary resin quality across post-consumer packaging streams requires reliable technical segmentation. MetaStat Insight delivered an objective assessment that distinguished between extrusion-grade flake pricing and optical sorting throughput limitations across Western Europe. The competitive positioning breakdown for licensed depolymerization technology providers answered several questions during our feedstock feasibility audit. Their team clarified regional trade restrictions on mixed plastic scrap quickly when our team submitted follow-up requests.
Explore related market intelligence reports worth reading alongside this one.