
LEAD ANALYST
Utkarsh Khirodkar is a Lead Market Research Analyst at MetaStat Insight, specializing in market intelligence, technology sector assessments, and competitive strategy.

Global Capital Expenditure Market Size, Share, By Investment Purpose (Capacity Expansion, Modernization and Productivity Improvement, Asset Replacement, Business Diversification, Regulatory and Environmental Compliance), By Asset Type (Buildings, Civil Engineering Infrastructure, Machinery and Equipment, ICT Equipment, Transport Equipment, Intellectual Property Products), By Spending Entity (Non-Financial Corporations, Financial Corporations, General Government, Households and Unincorporated Enterprises, Non-Profit Institutions Serving Households), By Total Project Investment Value (Below USD 10 Million, USD 10 Million to Below USD 100 Million, USD 100 Million to Below USD 1 Billion, USD 1 Billion and Above), Industry Analysis, Growth, Trends, and Forecast, 2026-2033
Report ID
MSI-5597
Published
October, 2026
Pages
251 Pages
Format
Historical
Base year
Forecast
Forecast period
Report Details
Market Valuation: Valued at $31,608.9 Billion in 2025, projected to reach $48,378.3 Billion by 2033 at a 5.4% CAGR.
Dominant Segment: Capacity expansion leads the Capital Expenditure market, driven by non-financial corporations' need to meet rising consumer demand and enhance production capabilities.
Geographic Lead: The Asia Pacific region holds the largest market share at 43.9%, fueled by increasing investments in infrastructure and a growing industrial base.
What's Inside: This report provides a comprehensive analysis of the Capital Expenditure market, detailing competitive coverage, investment trends, and forecasts from 2026 to 2033.
Investment Trends: Investment in modernization and productivity improvement is projected to grow significantly, reaching USD 12,549.3 billion by 2033, reflecting a strong commitment to operational efficiency.
Emerging Opportunities: The ICT Equipment segment is expected to grow at a CAGR of 8.6%, driven by the demand for digital transformation and advanced technological solutions across industries.
Choose Your License
Global Capital Expenditure Market
The global Capital Expenditure market was valued at USD 31,608.9 billion in 2025 and is projected to reach USD 48,378.3 billion by 2033, growing at a CAGR of 5.4% over the forecast period.
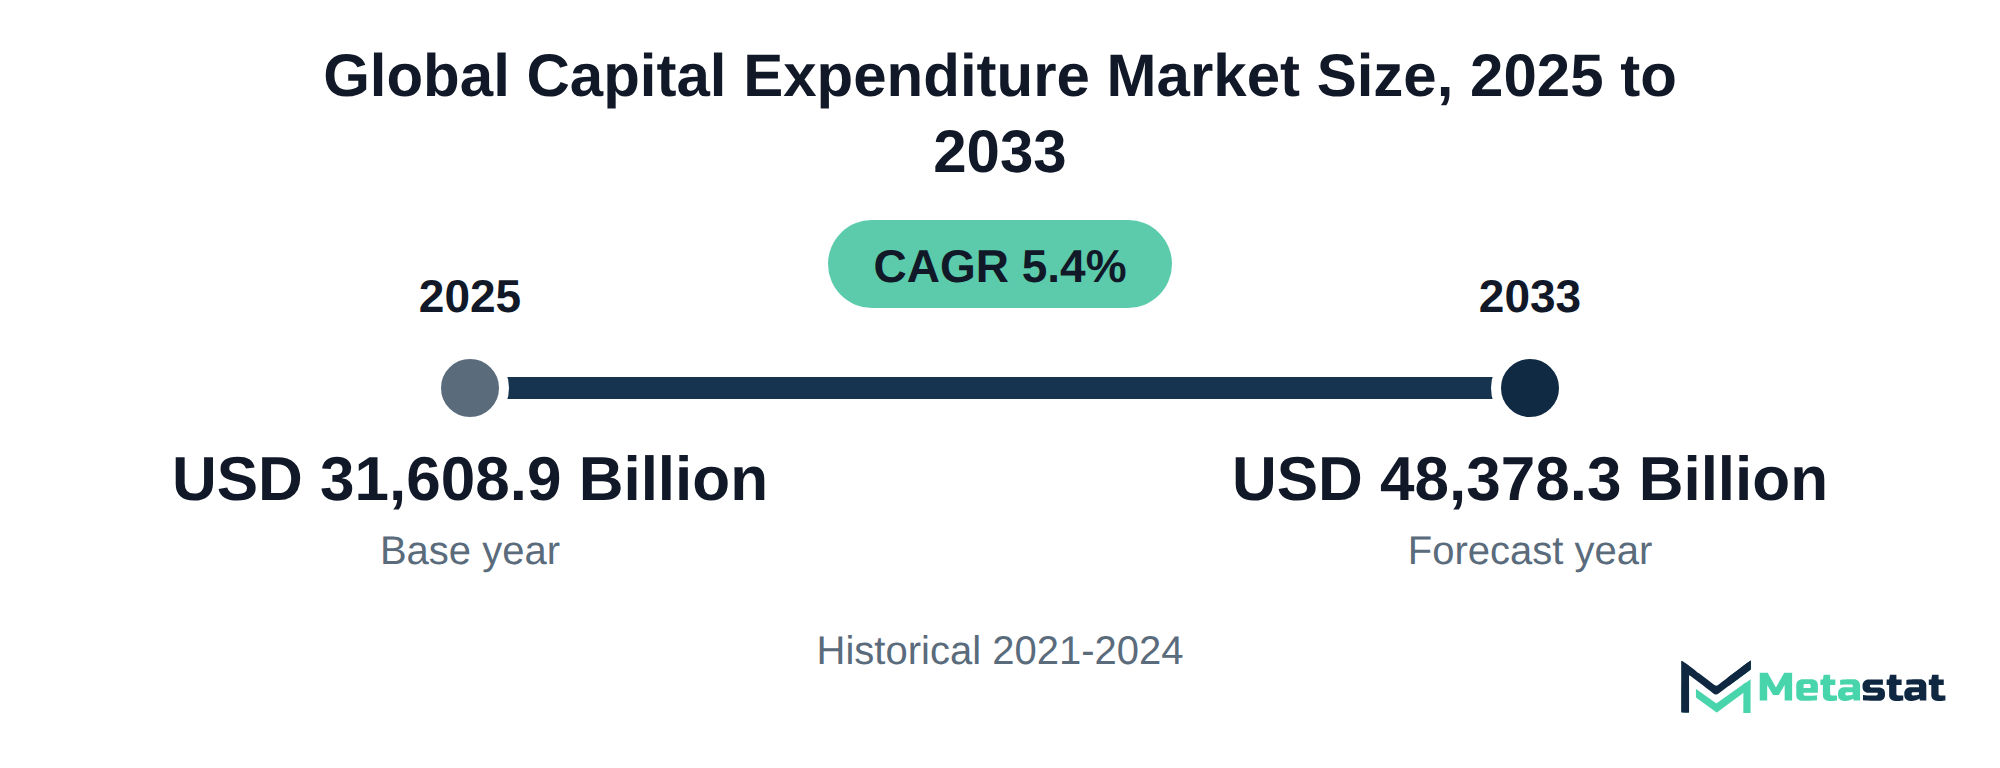
The Capital Expenditure market encompasses investments made by various entities to improve, expand, or replace physical and intangible assets. Buyers invest in this market to enhance operational efficiency, ensure compliance with regulations, and support long-term growth strategies. Modernization and productivity improvement drive significant spending across multiple sectors, with non-financial corporations representing the largest share of investments.
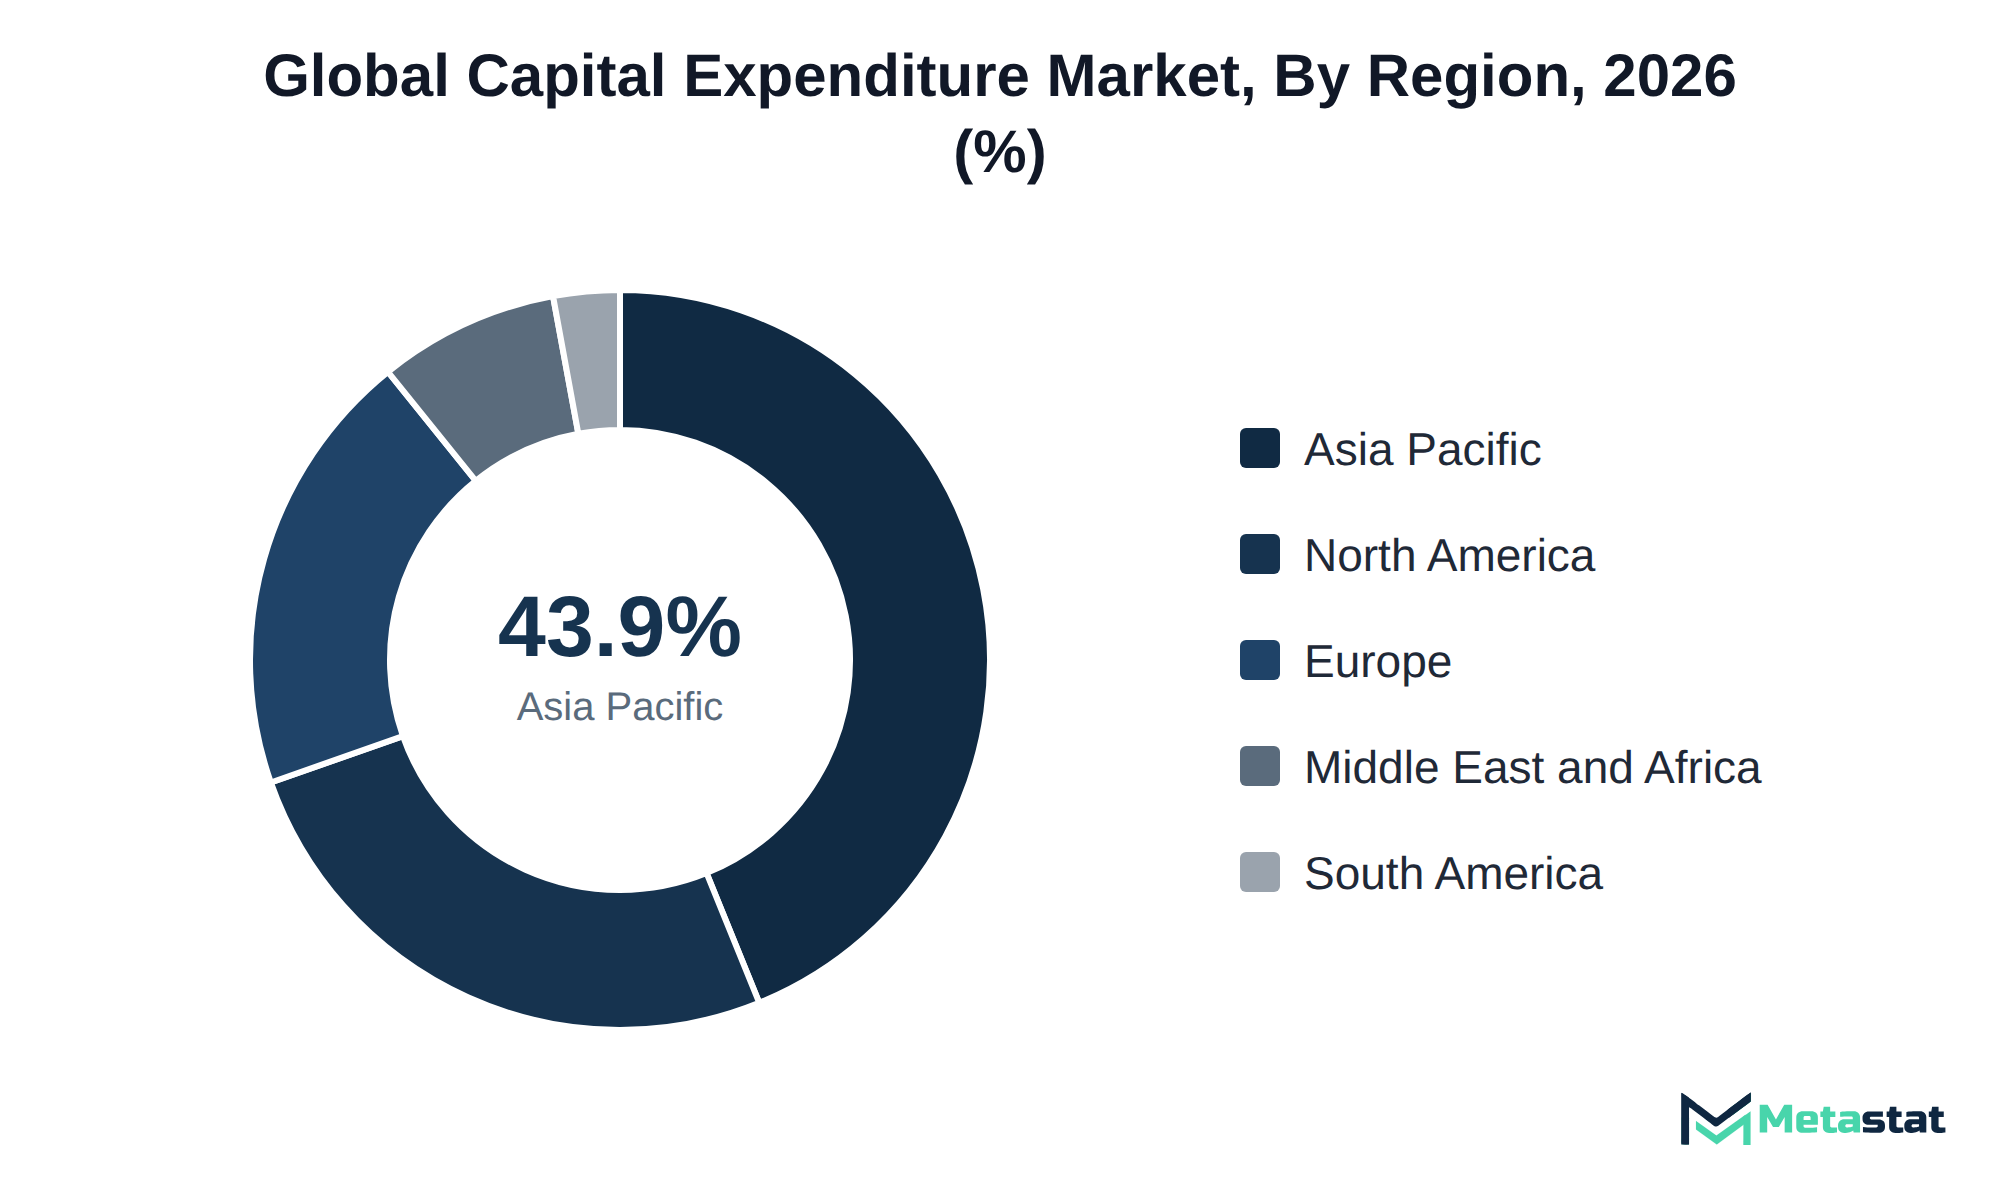
Growth within the market is fueled by increasing demand for capacity expansion, particularly in the Asia Pacific region, which holds a substantial 43.9% share of the market. North America holds 25.8% of the market in 2025, with the US leading in 2026. This geographic distribution indicates that investment concentrates in regions with strong economic activity, resulting in higher expenditure on infrastructure and equipment.
Capacity expansion remains the segment with the most value, reflecting the ongoing trend of businesses seeking to enhance production capabilities in response to market dynamics. The 4.8% growth rate in this segment shows that companies remain committed to investing in future capacity to stay competitive.
The Capital Expenditure market includes expenditures directed toward various investment purposes, including capacity expansion, modernization, and asset replacement. Buyers engage in this market to enhance operational efficiency, comply with regulations, and improve productivity. The demand for upgrading existing infrastructure and investing in new projects drives spending across multiple sectors, including non-financial corporations and government entities.
Capacity expansion represents the segment with the highest value, reflecting the growing need for increased production capabilities in response to rising consumer demand. Growth in the Asia Pacific region, with a 43.9% share, highlights an expanding industrial base and increasing investments in infrastructure, which significantly contribute to overall market dynamics.
The primary growth driver stems from the ongoing shift toward modernization and productivity improvement, driven by companies seeking to enhance operational capabilities and reduce inefficiencies. Organizations prioritize investments in advanced technologies and infrastructure upgrades to remain competitive. This trend highlights the market's potential for sustained growth and evolving investment strategies.
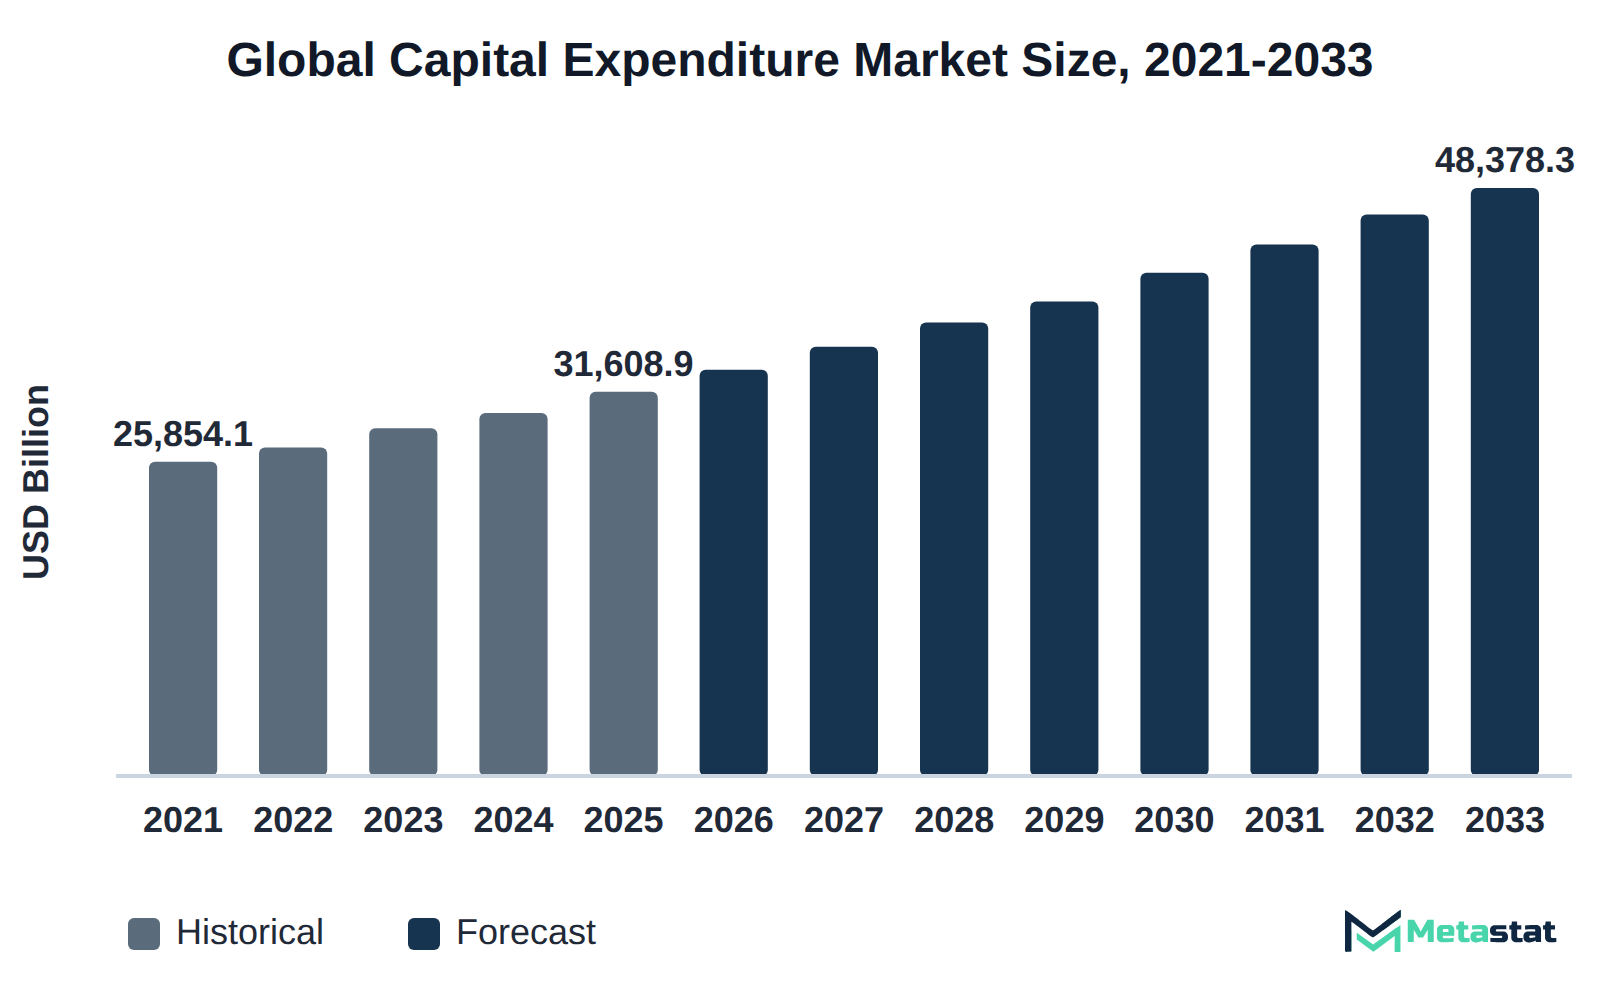
The integration of artificial intelligence infrastructure and smart grid expansion significantly alters priorities within the Capital Expenditure market. Investment in advanced technologies for energy management and distribution leads to a shift toward modernization and productivity improvement. This segment is expected to reach USD 12,549.3 billion by 2033, reflecting a compound annual growth rate of 6.6%. Such investment focuses on enhancing operational efficiency and reducing costs associated with traditional energy systems.
Corporations increasingly prioritize the adoption of AI-driven solutions to optimize energy use and streamline grid operations. These innovations contribute to improved decision-making and resource allocation, supporting sustainability initiatives. The rising demand for renewable energy sources drives the need for extensive grid modernization to accommodate distributed energy resources. Enhanced grid capabilities ensure reliable service while responding to fluctuating energy demands.
Financial commitments directed toward AI infrastructure and grid upgrades strengthen competitiveness and operational resilience within the market. This approach enables firms to leverage data analytics for predictive maintenance and improved service delivery, ultimately attracting investors seeking long-term growth opportunities. The emphasis on AI integration positions organizations to meet future energy challenges while optimizing capital expenditures.
Corporate capital budgets increasingly face competition from asset replacement and intelligent automation initiatives. Organizations invest in modernizing and automating their operations to enhance efficiency and productivity. This shift is reflected in the Capital Expenditure market, where modernization and productivity improvement investments are expected to reach USD 12,549.3 billion by 2033, demonstrating a compound annual growth rate of 6.6%. Such investments often entail substantial initial costs, compelling organizations to evaluate financing options carefully.
Purchasing decisions in the capital expenditure sector frequently involve complex negotiations around contract models and pricing structures. Buyers often seek flexible payment terms and financing arrangements to alleviate budget constraints. Many suppliers offer lease options, allowing organizations to acquire necessary assets without significant upfront capital outlay. These arrangements enhance cash flow management, making it easier for companies to navigate asset replacement cycles while investing in automation technologies.
Financial corporations play a significant role in this dynamic, with projected investments reaching USD 1,678.7 billion by 2033, reflecting a compound annual growth rate of 6.5%. Engaging with financial institutions enables companies to use tailored financing solutions that balance immediate needs with long-term capital planning. Competition intensifies, and organizations with innovative financing strategies are better placed to allocate resources effectively and fund both asset replacement and automation initiatives.
Megaproject cost inflation significantly impacts infrastructure financing, creating distinct challenges for non-financial corporations. These entities, responsible for a substantial portion of capital expenditure, require efficient allocation of resources while navigating rising project costs. In 2026, non-financial corporations are projected to invest USD 18,315.3 billion, growing to USD 27,149.9 billion by 2033, reflecting a compound annual growth rate of 5.8%.
This inflation creates pressure on budgets, leading organizations to reassess funding strategies and procurement approaches. Traditional financing methods require adjustments to accommodate increased costs, including seeking alternative funding sources or collaborating with public entities for shared investment. The necessity for innovative procurement strategies aligns with trends in the Capital Expenditure market, where maintaining profitability remains a priority amid fluctuating project expenses.
Rising megaproject costs drive non-financial corporations to refine their investment strategies and optimize resource allocation, which directly affects their competitiveness.
Balancing expansion, modernization, and compliance in capital expenditure presents a strategic challenge for businesses. Companies allocating investment towards capacity expansion, which reached USD 14.0 billion in 2026, prioritize increasing output and entering new markets. This segment demonstrates a compound annual growth rate of 4.8% through 2033, reflecting a strong desire among firms to scale operations.
In contrast, modernization and productivity improvement require significant investment to enhance operational efficiency and upgrade existing infrastructure. This category is projected to reach USD 12.5 billion by 2033, with a growth rate of 6.6%. Businesses addressing modernization effectively reduce long-term operational costs and improve service delivery.
Compliance CapEx, which involves adhering to regulatory and environmental standards, remains critical. Companies investing in compliance mitigate risks and improve their market positioning. Striking the right balance among these expenditure categories supports sustainable growth, reinforces competitive advantage, and enhances overall profitability in the evolving capital expenditure market.
Non-financial corporations drive increased capital expenditure primarily focused on capacity expansion efforts. This shift stems from growing demand for goods and services, prompting companies to scale operations to meet heightened requirements. The emphasis on expanding production capabilities reflects a strategic response to rising consumer expectations and competitive pressure.
In 2026, spending on capacity expansion is projected to reach USD 14,019.7 billion, with this figure increasing to USD 19,428.7 billion by 2033, illustrating a compound annual growth rate of 4.8%. This trend signals strong growth and positions the market favorably within the broader economy.
Investment in capacity expansion improves operational efficiency and strengthens market positioning for non-financial corporations. Continued focus on this area will significantly influence overall capital expenditure dynamics in the coming years.
Investment in modernization and productivity improvement represents another critical driver of growth in the Capital Expenditure market. Increased investment aimed at updating technology and optimizing processes will further accelerate efficiency and effectiveness across industries.
Technological advancements drive significant investment in modernization across various sectors, enhancing operational efficiency and productivity. Entities prioritize upgrades in machinery and equipment, resulting in increased capital expenditure for new ICT equipment and civil engineering infrastructure. This trend reflects a growing focus on integrating smart technologies that streamline processes and improve resource management.
Non-financial corporations view modernization as a means to maintain competitiveness and as a critical step toward regulatory compliance and sustainability goals. Businesses increasingly allocate budgets to projects aimed at replacing outdated systems, resulting in enhanced operational capabilities. The adoption of innovative technologies within the Capital Expenditure market facilitates a shift toward data-driven decision-making, creating potential for improved financial performance. Enhanced productivity through modernization initiatives supports market expansion, positioning firms to better respond to evolving consumer demands and market conditions.
Escalating costs associated with capital expenditure influence buyer investment decisions significantly. Non-financial corporations face constraints in their capital budgets, prompting slower uptake in new projects and delaying asset replacement initiatives. The impact of rising expenses is particularly evident in sectors reliant on budgetary approvals, where financial constraints hinder the ability to engage in modernization and capacity expansion. The constraints experienced by these corporations lead to smaller order volumes and a cautious approach to new project financing. This situation creates a challenging environment for suppliers, who adapt to changing buyer expectations and adjust their offerings accordingly. In turn, the Capital Expenditure market experiences fluctuations, reflecting these buyer dynamics and the need for strategic financial planning among corporations. The emphasis on cost management is expected to persist, shaping investment priorities across the market until economic conditions improve.
Suppliers in the Capital Expenditure market encounter significant challenges due to rising compliance costs. Regulatory frameworks increasingly demand investments in environmental and safety standards, leading to increased expenses for suppliers attempting to meet these requirements. Financial corporations and non-financial corporations face margin pressure stemming from these compliance-related costs, impacting overall profitability. Many suppliers respond to these challenges by investing in process improvements and sustainability strategies aimed at enhancing operational efficiency. This strategic shift assists in mitigating the financial burden that compliance imposes on operations.
Collaboration with industry experts and technology providers helps streamline compliance processes, reducing the time and resources needed for adherence. Suppliers use innovative solutions to optimize operations and offset the cost increases associated with regulatory compliance. Competitors continually adjust their strategies to protect margins as the regulatory environment changes.
Investment in ICT equipment presents a significant opportunity for growth within the Capital Expenditure market. This segment is growing at a compound annual growth rate (CAGR) of 8.6%, driven by increasing demand for digital transformation across industries. Corporations seek advanced ICT solutions to enhance operational efficiency and support modernization efforts. Rapid adoption of cloud computing, big data analytics, and Internet of Things (IoT) technologies fuels this trend, allowing businesses to leverage connectivity and improve productivity. The growing focus on cybersecurity measures emphasizes the necessity of investing in contemporary ICT infrastructure. This upward trajectory in ICT equipment spending signals strong growth potential in the market, positioning suppliers to capitalize on innovations and meet the evolving requirements of clients.
The Global Capital Expenditure market is segmented based on Investment Purpose, Asset Type, Spending Entity, and Total Project Investment Value.
This segment focuses on investments aimed at increasing operational capacity across various industries, including manufacturing, energy, and infrastructure. Non-financial corporations, driven by the necessity to meet growing demand and enhance production efficiency, predominantly allocate these funds. Strong demand for new infrastructure projects and technological upgrades drives capacity expansion initiatives, setting this segment apart from others including Asset Replacement, which typically experiences slower growth. Compared to Business Diversification and Modernization, which target different strategic objectives, Capacity Expansion emphasizes scaling operations and optimizing existing processes, thereby creating significant potential for future investment.
This segment focuses on upgrading existing assets and enhancing operational efficiency, primarily by non-financial corporations seeking to streamline processes and reduce costs. The digital transformation and the integration of advanced technologies drive this segment forward, reflecting a strong trend in automation and process optimization. Compared to other segments, this category shows faster growth, supported by a growing demand for improved productivity solutions. While asset replacement emphasizes maintaining the status quo, modernization fuels innovation and competitiveness in various industries, creating a distinct pathway for investment in the market. Ongoing advancements in technology accentuate the importance of this segment, influencing capital allocation strategies significantly.
Asset Replacement segment is expected to reach USD 9,588.6 billion by 2033. This segment encompasses investments aimed at replacing existing assets that have reached the end of their lifecycle or have become inefficient. Non-financial corporations commonly engage this segment to ensure operational continuity and reduce downtime. The increasing emphasis on sustainability and operational efficiency drives significant investment in asset replacement. This segment experiences a compound annual growth rate (CAGR) of 6.1%, which is higher than the growth rates of other investment purposes. The focus on regulatory compliance and environmental standards further influences spending in this area. By prioritizing asset replacement, organizations enhance their competitive edge while addressing evolving market demands. The Capital Expenditure market continues to adapt to these shifts, reflecting the critical importance of maintaining and upgrading essential assets.
Business Diversification segment is projected to grow at a CAGR of 6.1% during the forecast period. This segment focuses on investments aimed at broadening the scope of a company's operations, often by entering new markets or diversifying product lines. Non-financial corporations pursue diversification primarily to mitigate risks associated with market fluctuations and enhance revenue streams. Increasing pressures for innovative solutions and changing consumer preferences drive this segment's growth. Compared to other segments, including Capacity Expansion and Asset Replacement, Business Diversification experiences a relatively faster growth trajectory. The segment helps companies adapt to changing market conditions and strengthens their position within the Capital Expenditure market.
Regulatory and Environmental Compliance focuses on the expenditures made by organizations to meet legislation and environmental standards. Companies in various sectors, including manufacturing and energy, prioritize this segment to avoid penalties and enhance sustainability initiatives. One driving force behind this segment is the increasing regulatory pressures from governments, which compel firms to allocate resources toward compliance projects. This segment typically experiences slower growth compared to others like Capacity Expansion and Modernization, which benefit from stronger investment trends. Compliance spending is often seen as necessary but lacks the growth momentum seen in segments driven by technological advancements or market expansion. Organizations balance their compliance investments with other strategic priorities, presenting challenges and opportunities for capital allocation in the Capital Expenditure market.
Buildings segment is valued at USD 11,051.3 billion in 2026 and is projected to reach USD 14,687.6 billion by 2033, at a CAGR of 4.1% during the forecast period. This segment focuses on the construction and renovation of various building types, including residential, commercial, and industrial facilities. Non-financial corporations typically drive investment in this segment, reflecting ongoing demands for improved infrastructure and energy efficiency. Rising urbanization rates significantly influence the need for new buildings, contributing to steady demand. Compared to other asset types, the buildings segment exhibits slower growth, with a lower CAGR of 4.1% compared to segments like ICT equipment, which experience higher expansion rates. This distinction highlights differing priorities among buyers, focusing on long-term utility and sustainability rather than rapid technological upgrades.
Civil Engineering Infrastructure segment is estimated to reach USD 10,028.8 billion by 2033, at a CAGR of 5.7% during the forecast period. This segment encompasses investments in the construction and maintenance of vital public works, including roads, bridges, tunneling projects, and water supply systems, primarily used by government entities and non-financial corporations. The increasing emphasis on infrastructure development to support urbanization and population growth drives investment in this area. Regulatory changes aimed at enhancing safety and sustainability further influence spending patterns. Compared to other asset types, the Civil Engineering Infrastructure segment demonstrates slower growth relative to the ICT Equipment segment, which benefits from rapid technological advancements. However, its essential role in supporting broader economic development ensures consistent demand within the Capital Expenditure market.
The Machinery and Equipment segment is expected to reach USD 7,798.6 billion by 2033. This segment includes investments in machinery and equipment used by various industries, particularly manufacturing and construction. These assets facilitate production processes, enhance operational efficiency, and support technological advancements. The segment benefits from increasing automation trends, driving demand among non-financial corporations focused on improving productivity. Unlike other asset types, Machinery and Equipment experiences a significant growth rate, supported by a CAGR of 8.6%, which distinguishes it from segments including Buildings and Civil Engineering Infrastructure. Continuous advancements in technology further fuel investments in modern machinery, enabling companies to remain competitive. Overall market growth aligns with the increasing focus on efficiency and modernization across industries.
ICT Equipment segment is projected to grow at a CAGR of 8.6% during the forecast period. This segment includes investments in hardware, software, and telecommunications equipment, catering primarily to non-financial corporations, educational institutions, and government entities. Demand for ICT equipment rises due to increasing reliance on digital technologies and expansion of internet infrastructure across various sectors. The necessity for enhancing operational efficiencies and adopting advanced technologies drives this segment's growth. ICT equipment distinguishes itself from other asset types through its rapid growth rate and higher investment requirements. In contrast, segments including Civil Engineering Infrastructure and Buildings exhibit slower growth rates, reflecting differing investment priorities among buyers. By 2033, the segment's investment value is expected to reach significant levels, reflecting its critical role in modern organizational operations.
Transport Equipment encompasses various forms of vehicles and transportation systems across industries. This segment facilitates logistics and distribution for businesses, including non-financial corporations and government entities. Demand for this segment is driven by ongoing urbanization and the need for efficient transportation solutions. Factors including regulatory requirements and advancements in vehicle technology influence investments, driven by companies seeking to meet environmental standards while enhancing operational efficiency. Compared to other asset types, Transport Equipment experiences different growth dynamics, with its reliance on technological upgrades and compliance investments leading to varying adoption rates. The market's focus on this segment presents opportunities for companies to innovate and diversify their offerings.
Intellectual Property Products encompass intangible assets that organizations develop and maintain for commercial advantage, including patents, trademarks, copyrights, and trade secrets. Various industries, particularly those driven by innovation and technology, employ these assets to enhance competitive positioning and achieve financial returns. Existing demand for intellectual property is influenced primarily by the increasing importance of innovation in driving economic growth. Firms invest in these products to protect their innovations, thereby ensuring market exclusivity. Unlike other asset types, intellectual property products typically require less physical infrastructure, leading to lower associated costs. This sub-segment's focus on intangible assets contrasts with tangible investments in buildings and machinery, which often require substantial capital and operational commitment. In the broader context of the Capital Expenditure market, the need for these assets continues to grow, particularly among technology firms seeking to capitalize on advancements and secure their market share.
Others encompass cultivated biological resources and weapons systems. Businesses engaged in environmental sustainability efforts and defense sectors leverage this segment to enhance production capabilities and address strategic needs. The demand for advanced biological resources and sophisticated weaponry drives capital expenditures in this area. Increasing governmental and private sector engagements in sustainability projects drive investment in cultivated biological resources, while defense contracts stimulate spending on weapons systems. Compared to other asset types, this segment presents unique challenges and opportunities, influenced by regulatory requirements and technological advancements tailored for specialized applications. Investment dynamics differ significantly, with buyers in this segment often seeking high-value, long-term solutions that contrast with the broader market's focus on immediate operational improvements and capacity expansion.
This segment encompasses spending by businesses that invest in assets to expand operations, improve productivity, or modernize infrastructure. Driving factors include the necessity for technological upgrades and increased production capacity to remain competitive. Non-Financial Corporations exhibit a stronger growth trajectory than Financial Corporations, which are anticipated to reach USD 1,678.7 billion by 2033. The preference for long-term investments in infrastructure and facilities enables this segment to outperform others, highlighting its critical role in shaping the overall dynamics of the Capital Expenditure market.
Financial Corporations segment is estimated to reach USD 1,678.7 billion by 2033, at a CAGR of 6.5% during the forecast period. This segment involves investments made by banks, insurance companies, and investment firms, primarily focused on enhancing operational efficiency and regulatory compliance. Increasing regulatory demands drive spending, with financial institutions seeking to upgrade technology and systems to meet these requirements. The growth rate of this segment outpaces that of the General Government and Households and Unincorporated Enterprises segments. The emphasis on technology investments positions this segment uniquely, with a notable focus on ICT equipment, which experiences a CAGR of 8.6%. This distinct growth pattern highlights the competitive dynamics within the Capital Expenditure market, where financial corporations prioritize digital transformation to remain agile and compliant in a changing environment.
General Government segment is expected to reach USD 8,819.4 billion by 2033. This segment encompasses expenditures made by public sector entities to deliver public services and infrastructure projects. Demand in this area reflects governmental priorities, including social welfare, education, and public safety. Budget allocations driven by economic conditions or political agendas influence growth in the General Government segment, which tends to grow at a slower rate compared to segments including Non-Financial Corporations. Other segments prioritize faster expansion, given different funding mechanisms and investment strategies. The market dynamics regarding public spending significantly impact operational efficiency and service delivery quality.
Households and Unincorporated Enterprises segment is projected to grow at a CAGR of 4.1% during the forecast period. This segment includes expenditures made by individual households and unincorporated businesses for various essential services and goods, including home improvements and personal investments. Growth is driven by increasing disposable incomes and the desire for enhanced living standards. Compared to other segments, this segment experiences slower growth due to its focus on smaller-scale projects and personal finance constraints, which limit investment capacity. Unlike Non-Financial Corporations, which engage in large-scale capital projects and benefit from economies of scale, the Households and Unincorporated Enterprises segment operates within tighter financial constraints, impacting total investment levels in the Capital Expenditure market.
Non-Profit Institutions Serving Households focus on funding projects aimed at supporting community services and welfare initiatives. These organizations rely on donations, grants, and government support to finance their activities. Nonprofit fundraising conditions therefore shape the funds available for projects. Economic conditions significantly influence this segment, with fluctuations in funding sources directly impacting the scope of available projects. Unlike Non-Financial Corporations, which prioritize capital-intensive projects, this segment engages in smaller-scale initiatives that address immediate community needs. The lack of large-scale investment opportunities distinguishes this segment, resulting in slower growth compared to sectors like Non-Financial Corporations and Financial Corporations, both of which invest considerably in infrastructure and long-term asset development. The market reflects an increasing demand for transparency and accountability, compelling these institutions to optimize spending and maximize impact.
Based on geography, the Global Capital Expenditure market is divided into North America, Europe, Asia-Pacific, South America, Middle East, and Africa.
Investment in the Capital Expenditure market in North America is driven predominantly by non-financial corporations, particularly in sectors including technology, energy, and manufacturing. The projected value for this region is USD 12,172 billion by the end of 2033, reflecting a significant commitment to capacity expansion and modernization. The region accounted for 25.8% of the global market share in 2025, highlighting its substantial role in overall expenditure trends. Infrastructure development and regulatory demands further influence spending, with companies adapting to evolving market conditions and environmental standards. The strong economies of the United States, Canada, and Mexico support this investment environment and continued growth within the market.
Within Europe, significant demand in the Capital Expenditure market arises from several industrial sectors, particularly in Germany, France, and the UK. The focus on modernization and productivity improvement significantly influences expenditure patterns across various sectors. Infrastructure development drives spending, reflecting initiatives aimed at enhancing civil engineering and ICT capabilities. Regulatory frameworks and sustainability initiatives push firms towards expenditure that aligns with evolving environmental standards. With a share of 19.6% of the global market in 2025, the region is positioned for steady growth. The anticipated increase in investments from both non-financial and financial corporations highlights the ongoing commitment to advancing operational capacity and efficiency across Europe.
Asia-Pacific represents 43.9% of the global market in 2025. Demand in this region primarily stems from rapidly growing economies including China and India, where infrastructure development and technological advancement drive expenditures. The focus on modernization and productivity improvement within various sectors drives investments in capital assets. Countries like South Korea and Japan emphasize advancements in machinery and ICT equipment, while Australia invests heavily in civil engineering infrastructure. Infrastructure projects in Southeast Asia receive substantial government support, further contributing to market growth. The emphasis on regulatory compliance in construction and environmental standards necessitates ongoing investment in modernization efforts across industries.
The Capital Expenditure market in South America is characterized by significant investments in infrastructure, particularly in Brazil and Argentina. The demand for capacity expansion drives the market, fueled by growing urbanization and industrial development. Government initiatives aimed at improving transportation and energy sectors contribute to this trend, enhancing overall economic growth and attracting foreign investments. The region's market share stands at 2.9% in 2025, reflecting its emerging potential. Industries including construction and energy display substantial activity, with businesses focusing on modernization and productivity improvement to remain competitive. The Capital Expenditure market in South America demonstrates resilience amid economic fluctuations, driven by a commitment to enhancing infrastructure and operational capabilities.
Investment in the Middle East and Africa highlights unique dynamics within the Capital Expenditure market. The region's focus on infrastructure development, particularly in Saudi Arabia and the UAE, influences overall demand. Saudi Arabia infrastructure projects are a notable source of this demand. Governments in these countries initiate significant projects aimed at enhancing economic diversification and sustainability. South Africa, facing distinct challenges, emphasizes modernization and productivity improvement across various sectors. The market's share in this region is projected at 7.9% in 2025, driven by growing investments in civil engineering and ICT sectors. These activities contribute to an expanding market landscape while addressing regional needs for improved infrastructure and operational efficiency.
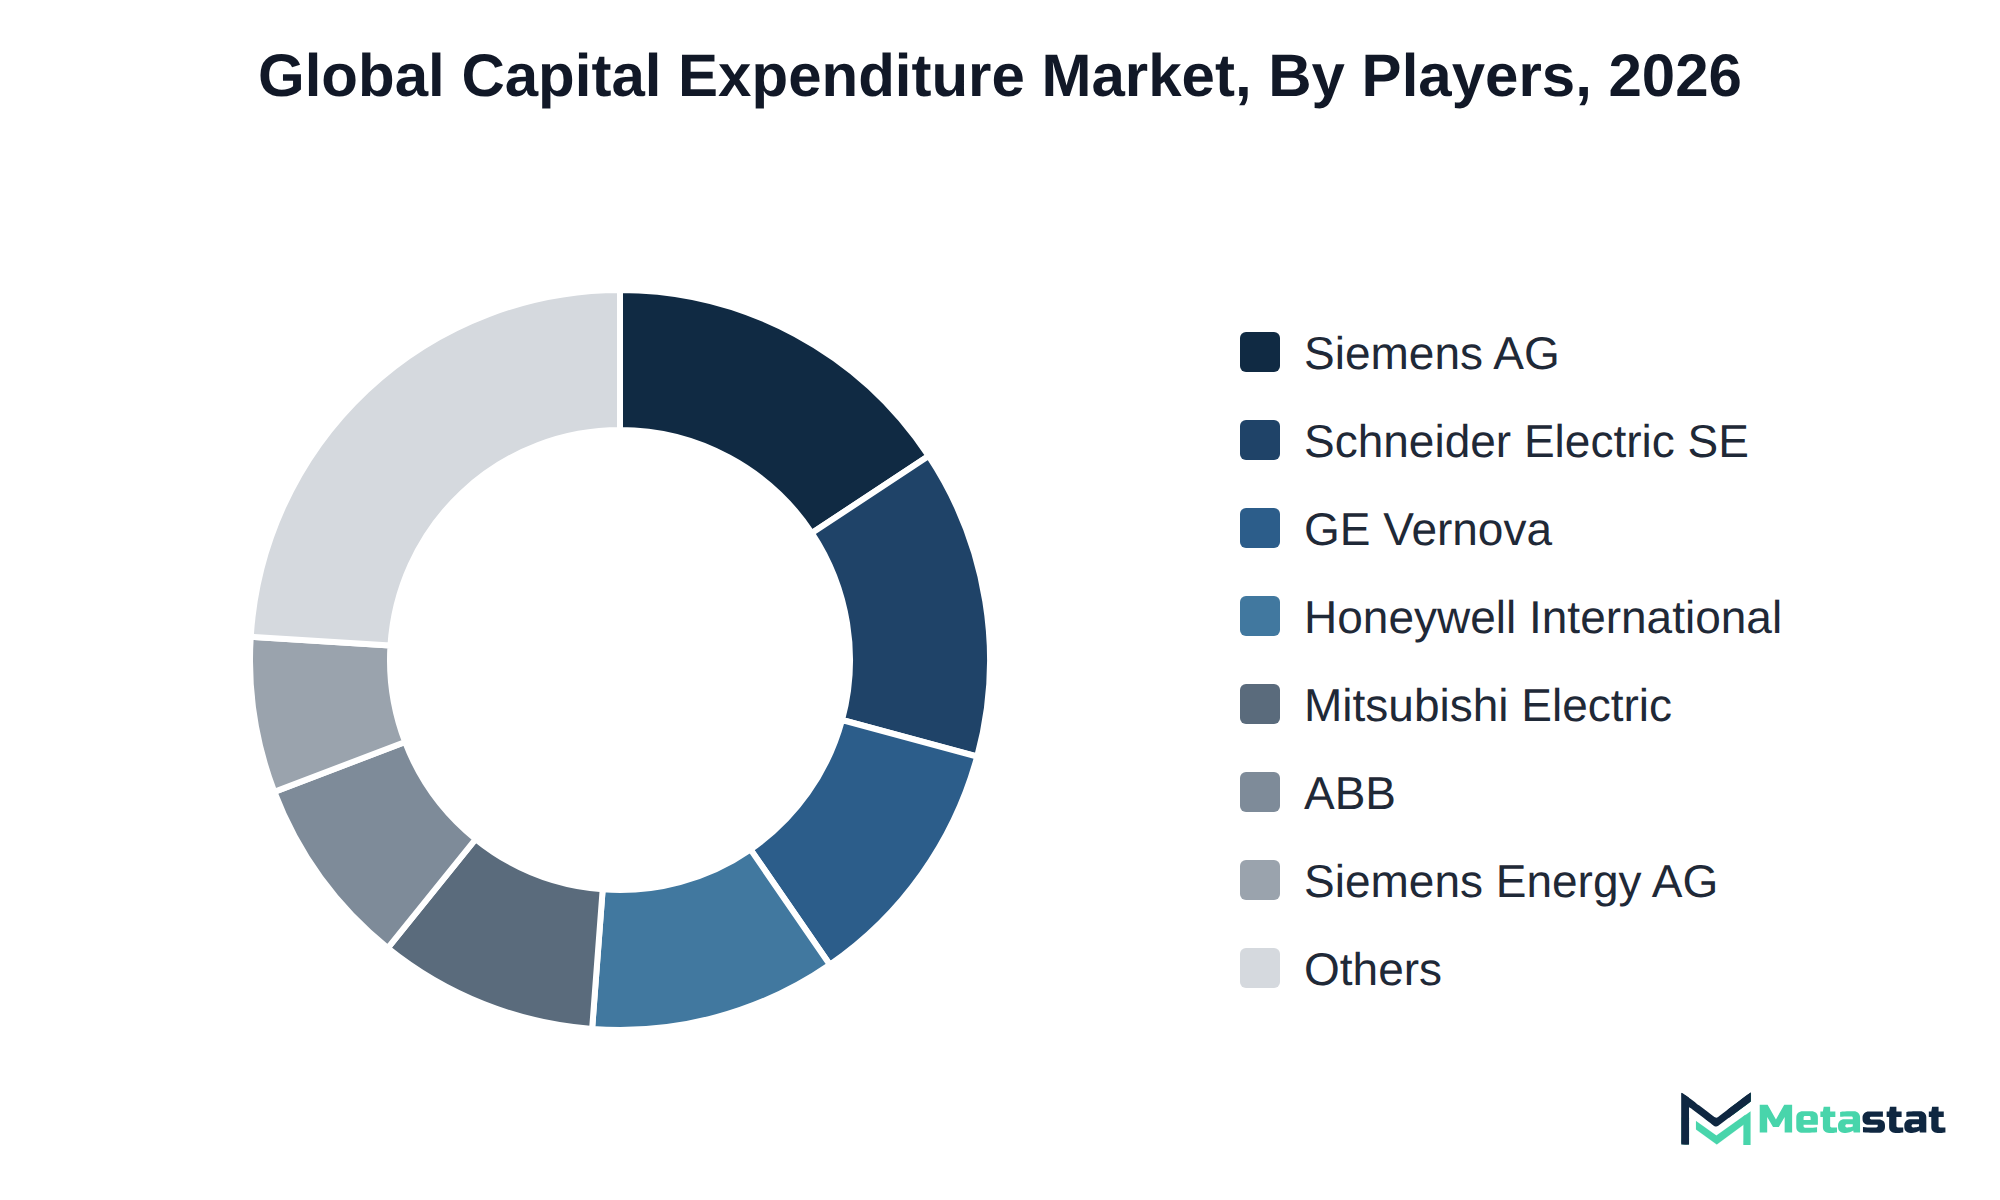
Competition within the Capital Expenditure market involves a variety of strategic approaches tailored to specific buyer needs. Companies differentiate themselves based on price, certification, customization, service quality, and the strength of their ecosystems. This diversification allows firms to cater to distinct industry requirements and client preferences, enhancing their competitive positioning.
Siemens AG and Schneider Electric SE prioritize innovative solutions and advanced technology integration within their offerings. GE Vernova Inc. targets sustainable energy projects, reflecting a growing trend towards environmental responsibility among buyers. Honeywell International Inc. emphasizes connectivity and smart technology in industrial applications, appealing to clients seeking efficiency and modernization in their capital expenditures.
Achieving this growth relies on several key developments. First, significant capacity expansion within the non-financial corporations segment will drive investment, with spending increasing from USD 18,315.3 billion in 2026 to USD 27,149.9 billion by 2033. Second, modernization and productivity improvement initiatives across various sectors will enhance operational efficiency, supporting investments that reach USD 12,549.3 billion by 2033. Third, strong investment in ICT equipment will help organizations adapt to technological advancements, contributing to the market's overall growth trajectory. However, risks exist that impede this positive outlook. Economic downturns, regulatory changes, or shifts in consumer preferences could slow capital expenditure growth, particularly affecting the financial sector, where spending is projected to reach USD 1,678.7 billion by 2033. The capital expenditure market remains sensitive to these variables, and organizations navigate these challenges effectively to sustain growth momentum.
By Investment Purpose: Capacity Expansion, Modernization and Productivity Improvement, Asset Replacement, Business Diversification, Regulatory and Environmental Compliance
By Asset Type: Buildings, Civil Engineering Infrastructure, Machinery and Equipment, ICT Equipment, Transport Equipment, Intellectual Property Products, Others (Cultivated Biological Resources, Weapons Systems)
By Spending Entity: Non-Financial Corporations, Financial Corporations, General Government, Households and Unincorporated Enterprises, Non-Profit Institutions Serving Households
By Total Project Investment Value: Below USD 10 Million, USD 10 Million to Below USD 100 Million, USD 100 Million to Below USD 1 Billion, USD 1 Billion and Above
The report strategically identifies and profiles the key market players and analyses their core competencies in each sub-segment of the Capital Expenditure market.
Report Attributes | Details |
Study Period | 2021-2033 |
Base Year | 2025 |
Estimated Year | 2026 |
Forecast Period | 2026-2033 |
Historical Period | 2021-2025 |
Growth Rate | CAGR 5.4% from 2026 to 2033 |
Revenue Unit | USD billion |
Segmentation | By Investment Purpose, Asset Type, Spending Entity, Total Project Investment Value, and Region |
By Region | North America (By Investment Purpose, Asset Type, Spending Entity, and Country)
|
Europe (By Investment Purpose, Asset Type, Spending Entity, and Country)
| |
Asia Pacific (By Investment Purpose, Asset Type, Spending Entity, and Country)
| |
South America (By Investment Purpose, Asset Type, Spending Entity, and Country)
| |
Middle East and Africa (By Investment Purpose, Asset Type, Spending Entity, and Country)
|
Find answers to common questions about this report
The Capital Expenditure market size was valued at USD 31,608.9 billion in 2025.
The market is projected to grow at a CAGR of 5.4% during the forecast period from 2026 to 2033.
The North America Capital Expenditure market size is estimated to reach USD 12,172 billion by 2033.
Capacity Expansion leads the Capital Expenditure market with a value of USD 14,019.7 billion in 2026, reflecting its significant role in driving investment compared to other segments.
Key drivers for the Capital Expenditure market include increased investment in capacity expansion due to heightened demand for goods and services, and modernization efforts aimed at enhancing operational efficiency through technological advancements. These factors contribute to a projected market growth from USD 31,608.9 billion in 2025 to USD 48,378.3 billion by 2033.
Asia Pacific holds the dominant share of the Capital Expenditure market, accounting for 43.9 percent in 2025. This region's significant share reflects robust investment activities compared to North America and Europe.
Escalating costs associated with capital expenditure significantly influence buyer investment decisions, leading to smaller order volumes and a cautious approach to new project financing. Suppliers face challenges due to rising compliance costs, which pressure margins and impact overall profitability.
Investment in ICT equipment is driving significant adoption within the Capital Expenditure market, with a compound annual growth rate of 8.6%. The increasing demand for digital transformation and advanced ICT solutions enhances operational efficiency and supports modernization efforts across various industries.
The Capital Expenditure market is estimated to reach a valuation of USD 48,378.3 billion by 2033.
Key players operating in the Capital Expenditure market include Siemens AG, ABB Ltd, Schneider Electric SE, GE Vernova Inc., Hitachi, Ltd., Mitsubishi Electric Corporation, Honeywell International Inc., and Emerson Electric Co.
The analysts below cover Banking & Finance research at Metastat Insights.
LEAD ANALYST
Utkarsh Khirodkar is a Lead Market Research Analyst at MetaStat Insight, specializing in market intelligence, technology sector assessments, and competitive strategy.

PRINCIPAL CONSULTANT - ENTERPRISE AI & EMERGING TECHNOLOGIES
Banking & Finance · Electronics and Semiconductor · Energy and Power · Healthcare IT · Information & Technology · Professional Services
Vijay Gunti is a Principal Consultant at MetaStat Insight, bringing over two decades of experience across enterprise digital transformation, technology strategy, and intelligent systems.
Tracking capacity expansion in single-use bioprocessing requires dependable data on raw material availability and cleanroom-grade polymer supply chains. The competitive landscape chapter gave a grounded evaluation of secondary component suppliers across North America and Asia-Pacific rather than simply reprinting press releases. Having that level of supplier benchmarking helped clarify dual-sourcing considerations for our clinical pipeline planning.
When evaluating distributed energy resource management systems, standard research summaries tend to gloss over the operational differences between front-of-the-meter utility deployments and behind-the-meter industrial sites. The MetaStat Insight report addressed those distinctions directly, especially regarding software interoperability standards and grid interconnection backlogs. The five-year market sizing across regional transmission organizations provided actionable context for our grid modernization strategy.
Most industry reports on warehouse automation bundle autonomous mobile robots and fixed conveyor installations into the same top-level numbers, which complicates advisory work. This study split the market cleanly by payload tiers, navigation technology, and fleet management software layers. The regional forecast for Western Europe gave our team defensible adoption benchmarks when evaluating capital allocation for logistics clients, saving us days of secondary data scrubbing.
Explore related market intelligence reports worth reading alongside this one.