
LEAD ANALYST
Utkarsh Khirodkar is a Lead Market Research Analyst at MetaStat Insight, specializing in market intelligence, technology sector assessments, and competitive strategy.

Global Carbon Credit Market Size, Share, By Market Type (Compliance and Voluntary), By Project Type (Avoidance / Reduction Projects, Nature-based Removal / Sequestration and Technology-based Removal / Sequestration), By End Use (Power, Energy Supply, Aviation, Transportation, Buildings, Industrial and Others), By Delivery Type (Spot / Physical and Futures & Forwards), Industry Analysis, Growth, Trends, and Forecast, 2026-2033
Report ID
MSI-3864
Published
October, 2026
Pages
265 Pages
Format
Historical
Base year
Forecast
Forecast period
Report Details
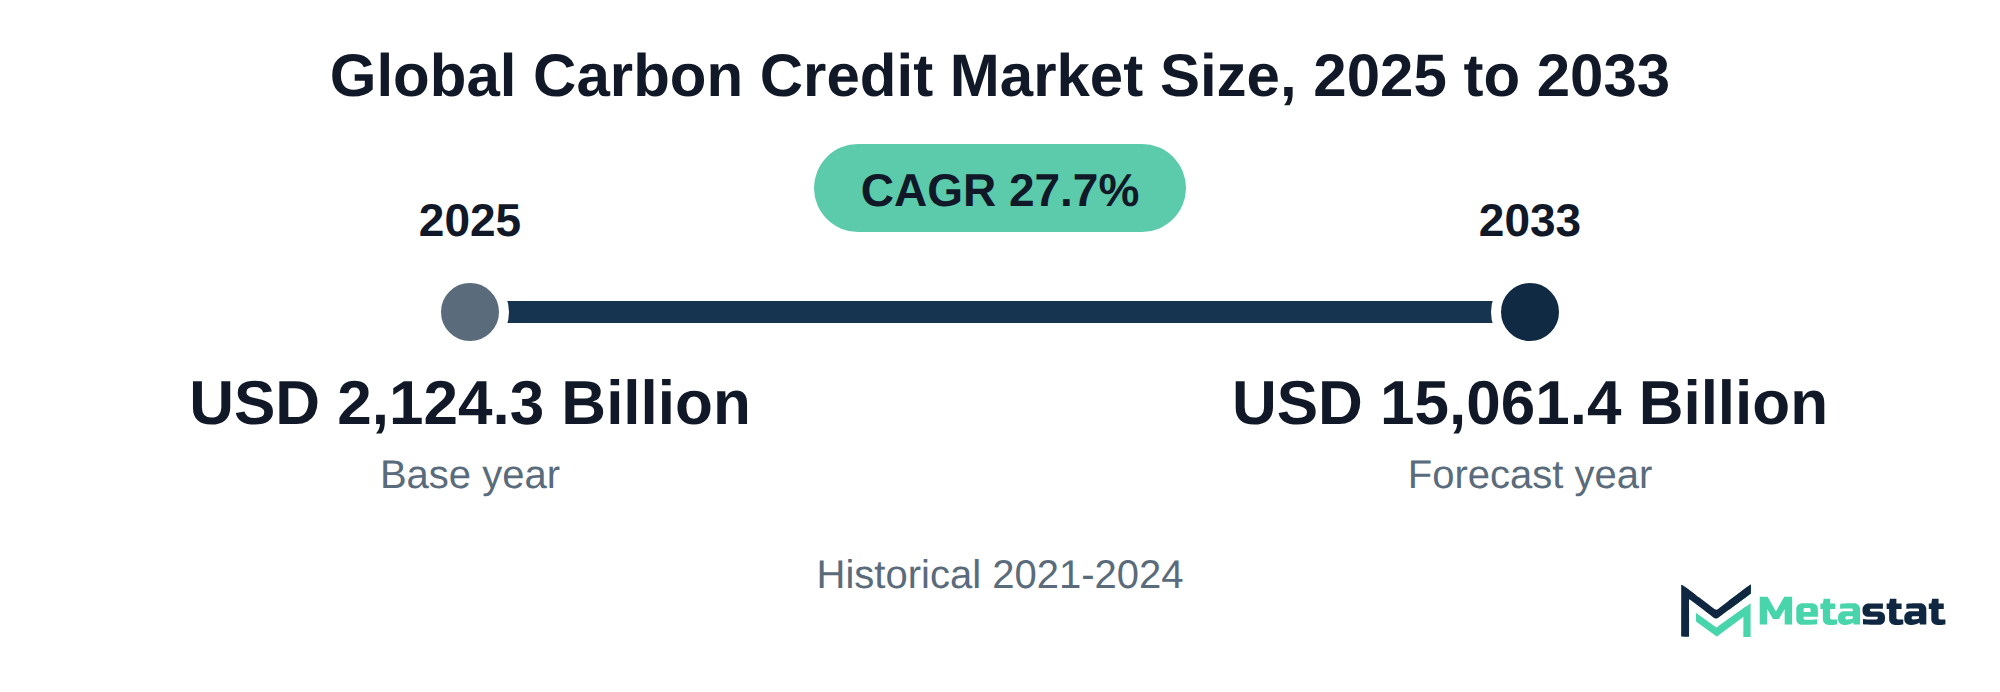
Market Valuation: Valued at $2,124.3 Billion in 2025, projected to reach $15,061.4 Billion by 2033 at a 27.7% CAGR.
Dominant Segment: The compliance segment leads the market, driven by stringent regulatory requirements compelling companies to offset emissions. This segment is projected to grow significantly, reaching USD 14,440.8 billion by 2033.
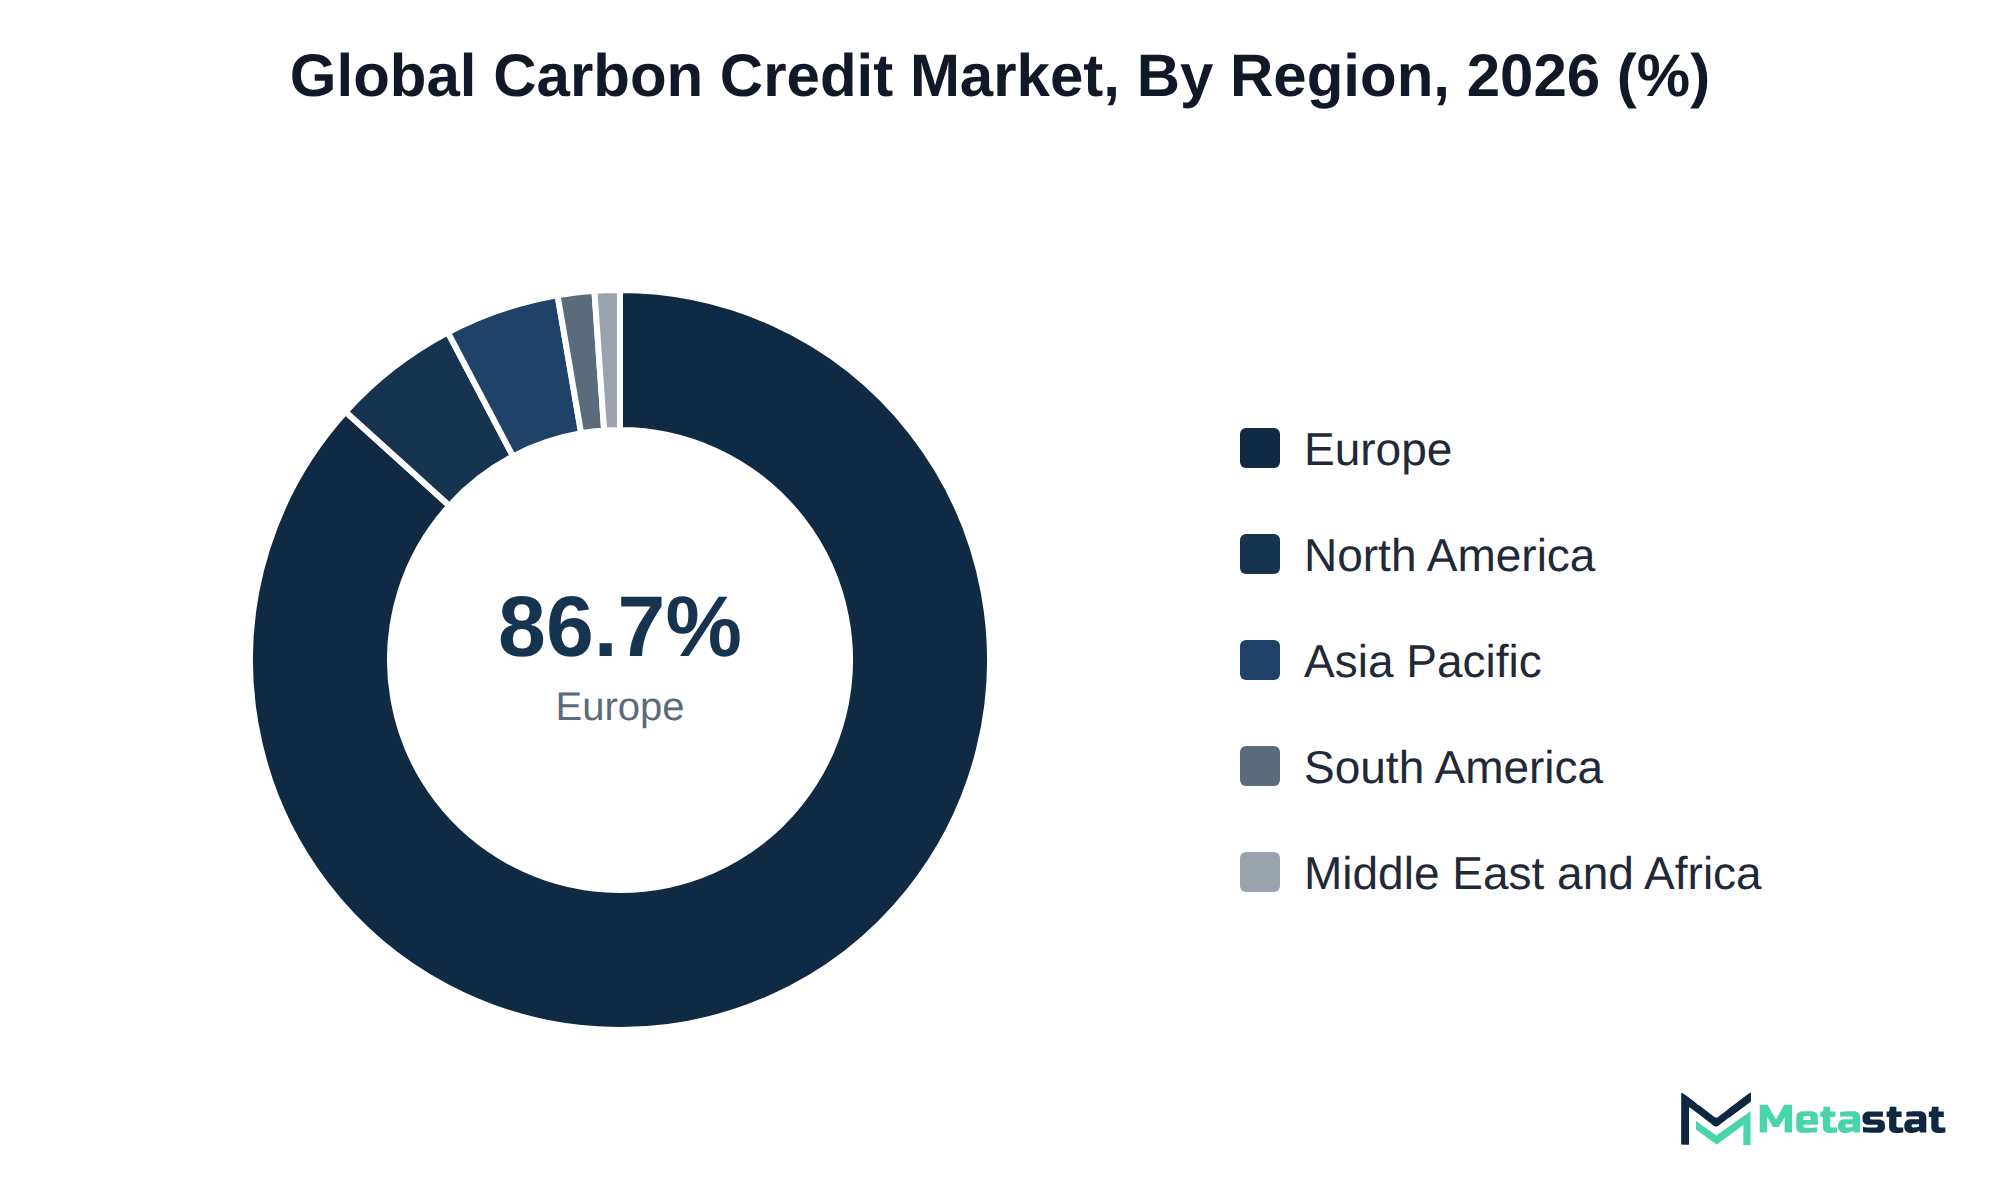
Geographic Lead: Europe dominates the carbon credit market with an 86.7% share, attributed to its robust regulatory framework and commitment to climate goals. North America follows, with the US expected to lead in compliance credit purchases by 2026.
What's Inside: The report provides a comprehensive analysis of the carbon credit market, including competitive coverage, market segmentation by type and delivery, and detailed forecasts from 2026 to 2033. It also explores trends influencing buyer behavior and market dynamics.
Growing Voluntary Segment: The voluntary carbon credit segment is experiencing rapid growth, projected to reach USD 620.5 billion by 2033, driven by corporate sustainability initiatives and increasing awareness of environmental responsibility.
Impact of Removal Projects: Nature-based and technology-based removal projects are reshaping purchasing dynamics, with buyers increasingly favoring long-term, sustainable solutions that provide verified carbon sequestration.
Choose Your License
Global Carbon Credit Market
The global Carbon Credit market was valued at USD 2,124.3 billion in 2025 and is projected to reach USD 15,061.4 billion by 2033, growing at a CAGR of 27.7% over the forecast period.
The Carbon Credit market encompasses the trading of carbon emission allowances and credits, aimed at reducing greenhouse gas emissions globally. Buyers in this market, including industries and governments, engage in carbon credit purchasing to comply with environmental regulations and meet sustainability targets. The financial commitment stems from the necessity to mitigate climate change impacts while balancing operational costs with environmental responsibilities.
Growth in the market is driven primarily by increasing regulatory pressures and corporate sustainability initiatives. The compliance segment captures the highest value, reflecting substantial demand for verified emissions reductions. Europe leads the market with a share of 86.7%, reflecting its strong regulatory framework and commitment to climate goals. North America holds 5.6% of the market in 2025, with the US leading in 2026.
Avoidance and reduction projects are a major driver of market expansion. These projects offer businesses a pathway to offset emissions effectively while contributing to sustainable development. Increasing awareness regarding climate change and the importance of carbon neutrality fuels demand across various sectors, enhancing participation in the Carbon Credit market.
The Carbon Credit market includes various mechanisms for trading carbon credits and allowances, which help organizations meet regulatory requirements while contributing to global emissions reduction efforts. Buyers invest in carbon credits for several reasons, including compliance with emissions regulations, corporate social responsibility initiatives, and the pursuit of sustainable business practices. This market serves a diverse range of industries, with significant participation from power generation, transportation, and manufacturing sectors, all seeking to offset their carbon footprints.
Growth in the market is driven by increasing regulatory pressure and the rising emphasis on sustainability across multiple sectors. The Compliance segment represents the largest share of the market, reflecting the demand from companies required to adhere to emissions targets set by governments. Europe dominates the market with an 86.7% share, largely due to stringent regulations and well-established carbon trading schemes. North America is projected to hold a 5.6% share of the market in 2025, with the US anticipated to lead in 2026.
Investment in avoidance and reduction projects fuels further expansion. This segment encompasses initiatives aimed at preventing emissions, which appeal to buyers focused on proactive environmental strategies. The emphasis on innovation and technology supports the growth of nature-based and technology-based solutions, enhancing the overall market.
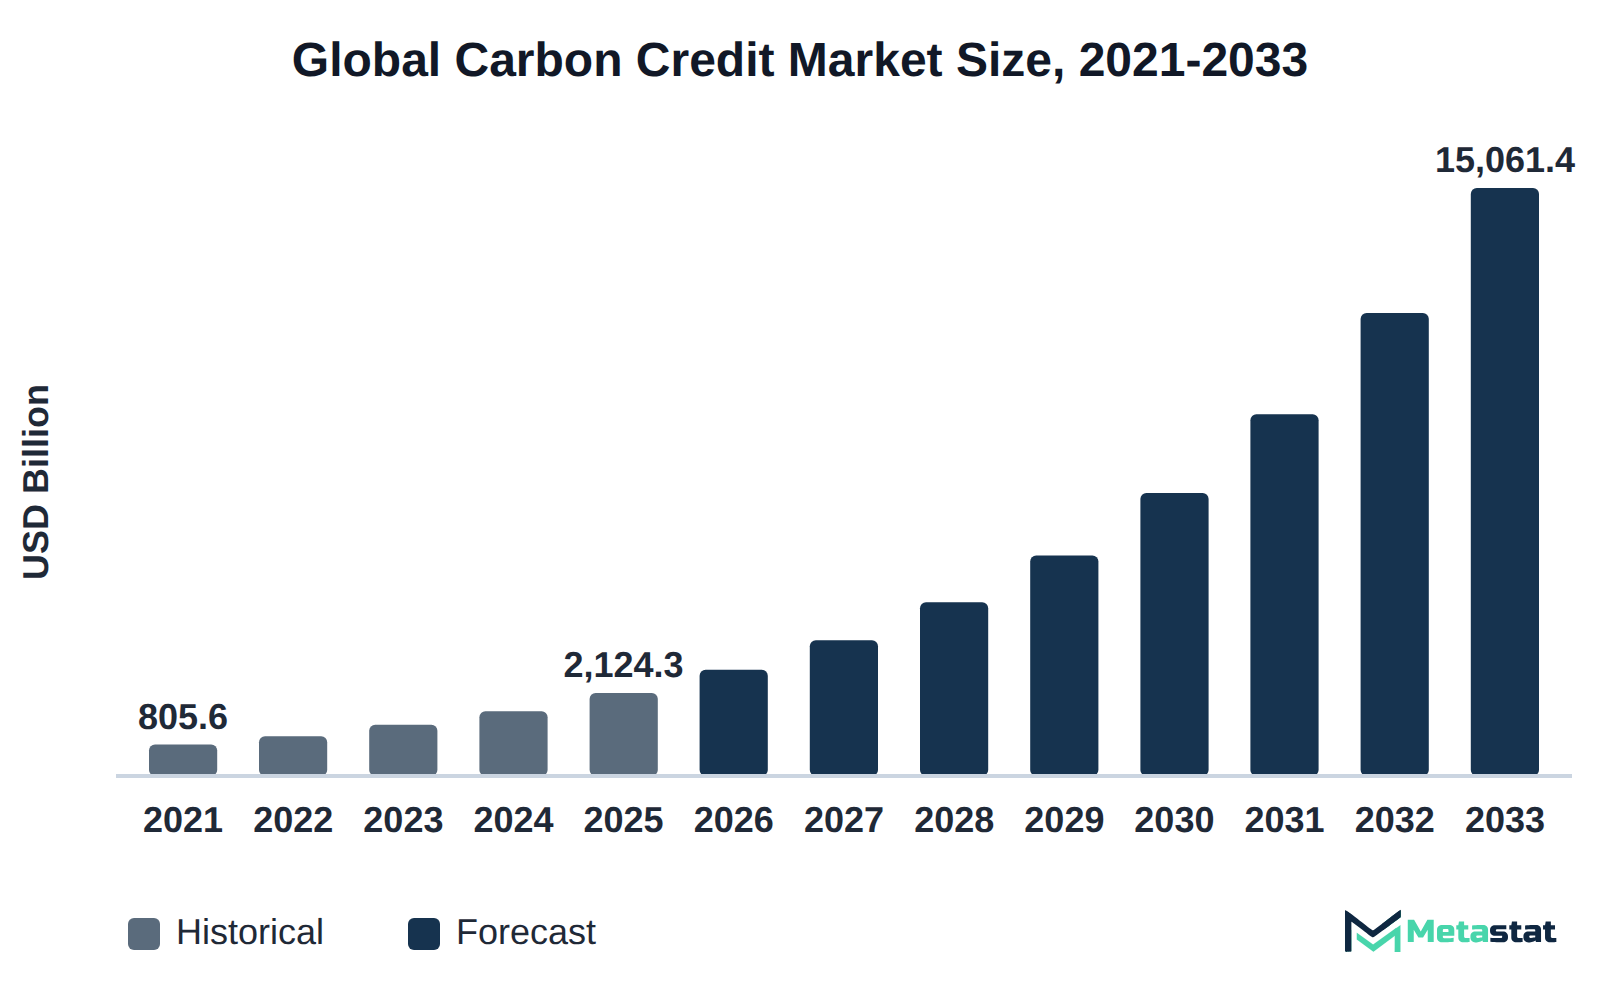
Compliance trading significantly influences the structure and dynamics of the carbon credit market. This trading mechanism stems from regulatory frameworks designed to limit greenhouse gas emissions, creating a market where entities purchase credits to comply with legal obligations. By 2033, the compliance segment value is projected to reach USD 14,440.8 billion, growing at a compound annual growth rate (CAGR) of 27.3%. This rapid expansion points to strong demand for compliance-related credits, driven by increasing environmental regulations across industries.
Exchanges dedicated to carbon credit trading facilitate the buying and selling of these credits, enhancing market transparency and liquidity. They provide a structured environment for transactions, allowing participants to access real-time pricing and information. As these exchanges develop, they support compliance trading and draw a diverse mix of buyers, including corporations seeking to meet regulatory requirements. Companies that invest in compliance trading manage their carbon liabilities and align their operations with sustainability goals.
The integration of nature-based and engineered removal projects significantly alters purchasing dynamics in the Carbon Credit market. Buyers increasingly prioritize projects that provide verified and long-term carbon sequestration solutions. One example is nature-based removal and sequestration, projected to reach USD 4,521.4 billion by 2033, reflecting a compound annual growth rate of 27.6%. This shift shows buyers increasingly preferring environmentally beneficial methodologies.
Contract models for these carbon credits often involve fixed pricing, enabling buyers to plan budgets with greater accuracy. Buyers are inclined toward long-term agreements, securing a stable supply of credits tied to specific projects. Such contracts enhance predictability and strengthen relationships with project developers, facilitating funding for initiatives that prioritize low-impact removal strategies. The willingness to engage in longer contracts reflects broader market trends emphasizing sustainability and accountability in carbon mitigation efforts.
Buyers increasingly align their strategies with environmental objectives, acting as proactive contributors to climate goals while ensuring compliance with regulatory frameworks. The preference for nature-based and engineered removals enhances market credibility and supports growth in the carbon credit sector.
Power, industry, and aviation buyers significantly influence the dynamics of the carbon credit market. These sectors exhibit distinct purchasing behaviors driven by their operational needs and regulatory frameworks. For instance, the power sector shows a projected increase in carbon credit spending, with values rising from USD 0.840 billion in 2026 to USD 4.392 billion by 2033, reflecting a compound annual growth rate of 26.7%. This growth stems from stringent emission regulations and the transition towards sustainable energy sources such as renewable energy.
In the aviation sector, purchasing carbon credits focuses on offsetting greenhouse gas emissions from air travel, with projected values reaching USD 1.994 billion by 2033. The industry's commitment to sustainability creates a robust demand for verified carbon credits, which contributes to the overall market's growth. Aviation buyers prioritize high-quality credits linked to credible projects, impacting pricing and availability.
Industry buyers, particularly those in heavy manufacturing, seek to meet compliance obligations while enhancing their corporate social responsibility profiles. The evolving landscape of carbon pricing and emissions trading schemes positions these buyers as significant players in the carbon credit market, shaping demand and influencing market strategies across sectors.
Buyers prioritize quality, price, and delivery risk when engaging in the Carbon Credit market. Quality assurance remains essential to ensure that credits represent genuine emissions reductions. Heightened demand for credible carbon credits compels buyers to assess quality closely.
Price sensitivity influences purchasing decisions, particularly in a competitive landscape. Voluntary carbon credits are expected to total USD 620.5 billion by 2033, with a robust CAGR of 44%. This price disparity between compliance and voluntary credits encourages buyers to explore options that align with budgetary constraints while fulfilling sustainability goals. The delivery risk associated with credits involves the reliability of sourcing, transaction timelines, and market fluctuations that impact operational costs.
The balance between quality, price, and delivery risk ultimately shapes procurement strategies, directly affecting a buyer's reputation and environmental impact. Buyers that effectively navigate these factors position themselves favorably within the evolving Carbon Credit market, enhancing both compliance and corporate responsibility outcomes.
A significant rise in corporate sustainability initiatives drives increased purchases of carbon credits across various industries. Organizations prioritize carbon neutrality targets, prompting heightened demand from buyers committed to reducing their carbon footprints. Carbon footprint management programs give these organizations a structured way to measure and reduce emissions. This shift in corporate behavior reflects broader societal expectations regarding environmental responsibility. The compliance segment is projected to grow from USD 2.671 billion in 2026 to USD 14.441 billion by 2033, indicating a compound annual growth rate of 27.3 percent. Companies increasingly treat carbon credits as essential tools for achieving sustainability goals. The market experiences heightened activity, with companies actively seeking compliance credits to meet regulatory obligations while enhancing their credibility with stakeholders. Efforts to integrate carbon credits into corporate strategies support price stability and increase overall market engagement.
Technological advancements in data analytics and blockchain are transforming pricing mechanisms within the market. These innovations enhance transparency and enable real-time tracking of carbon credit transactions, increasing trust among buyers and sellers. Increased accessibility to digital platforms allows smaller players to participate, broadening the market’s participant base and driving competition.
Efficient pricing models emerging from these technologies promote dynamic pricing strategies, reflecting supply and demand fluctuations. This contributes to a more competitive marketplace, with prices adapting to market conditions more rapidly. Volatility in pricing affects buyers' purchasing strategies, compelling organizations to adopt more agile procurement approaches. Enhanced price discovery mechanisms, supported by technological innovations, further enable market participants to optimize their purchasing timeframes. More sophisticated pricing strategies ultimately lead to a more mature market and encourage investment and participation.
Price fluctuations significantly impact purchasing behaviors among buyers in the Carbon Credit market. Higher prices discourage participation, particularly among small to medium-sized enterprises that face tighter budget constraints. These businesses experience slower uptake and smaller orders due to affordability concerns. Rising credit costs lead companies to postpone investments in carbon reduction projects or seek alternatives that lack the same benefits. For larger corporations, the emphasis on compliance drives demand, but sensitivity to price remains a consideration that delays strategic decisions. Overall, these factors limit the market's growth potential and hinder broader adoption across various sectors despite increasing urgency for emission reductions.
Suppliers face significant challenges due to rising compliance costs associated with carbon credit regulations. The increasing complexity of regulatory frameworks and the necessity for enhanced reporting capabilities drive higher operational expenses. Suppliers absorb these costs, impacting their profit margins and pricing structures, which complicates their ability to remain competitive in the market.
In response, suppliers are investing in technology to streamline compliance processes and enhance efficiency. Automation of data collection and reporting minimizes the impact of compliance costs on overall profitability. Regulatory reporting platforms are one example of tools that support this kind of automation. Partnerships with specialized firms give suppliers expertise and resources to manage these challenges. This shift toward technological solutions and collaboration enables suppliers to maintain a competitive edge in the evolving Carbon Credit market.
The voluntary carbon credit segment experiences rapid growth driven by increasing interest in sustainability practices among companies. This segment is projected to achieve a compound annual growth rate (CAGR) of 44% by 2033, reaching a market value of USD 620.5 billion. Corporate buyers seeking to offset their carbon footprints fuel this demand, opting for credits that support various environmental projects. Emphasis on transparency and quality in project selection enhances buyer confidence and willingness to invest in carbon credits. Organizations strive to meet their sustainability goals, and the voluntary market provides an avenue for them to contribute positively to environmental efforts. The projected expansion opens opportunities for innovative project development, enhancing revenue streams for suppliers while facilitating the growth of the overall market. Investment in quality assurance processes is expected to determine competitive advantage within this segment.
The Global Carbon Credit market is segmented based on Market Type, Project Type, End Use, and Delivery Type.
This segment primarily involves regulated entities and industries required to adhere to specific emissions reduction targets, often set by governmental bodies. Demand for compliance credits is driven by stringent regulatory frameworks that compel companies to offset their emissions or face penalties. Compared to the voluntary segment, which focuses on self-motivated carbon offsetting, compliance trading experiences stable growth influenced heavily by regulatory requirements. The higher barriers to entry and the structured nature of compliance markets afford it a unique positioning characterized by larger transactions and a more formal trading environment. These differences in motivation and operating framework set compliance trading apart from voluntary initiatives and shape purchasing behavior.
Voluntary segment is estimated to reach USD 620.5 billion by 2033, at a CAGR of 44% during the forecast period. This segment serves organizations aiming to offset their carbon footprints voluntarily, driven by corporate social responsibility and sustainability goals. Corporations, NGOs, and individuals purchase credits to demonstrate their commitment to environmental stewardship. Rapid growth stems from heightened awareness and initiatives focused on environmental impact. Unlike compliance credits, which adhere to regulatory requirements, voluntary credits provide more flexibility and innovation in sourcing and pricing strategies. Increasing demand for voluntary credits is projected to outpace compliance credits, which have a CAGR of 27.3% during the same period. This divergence highlights a growing preference for sustainable practices that extend beyond regulatory obligations, positioning the voluntary segment as a leader in market dynamism.
Avoidance / Reduction Projects segment is valued at USD 1,767.2 billion in 2026 and is projected to reach USD 9,179.9 billion by 2033, at a CAGR of 26.5% during the forecast period. This segment involves projects that aim to prevent the release of greenhouse gases or reduce their impact. Companies across various sectors, including manufacturing and energy, engage in these projects to meet regulatory requirements and enhance sustainability practices. The growing emphasis on environmental responsibility drives demand, with firms integrating carbon management systems into their operational strategies. Compared to Nature-based Removal / Sequestration, which has a CAGR of 27.6%, Avoidance / Reduction Projects exhibit slightly slower growth. However, the focus on immediate emission reductions positions this segment as a crucial component of corporate strategies aimed at compliance and sustainability, highlighting its relevance in the evolving carbon credit market.
This segment focuses on projects that engage natural processes, including reforestation and conservation, to remove carbon dioxide from the atmosphere, appealing to companies aiming to offset their emissions sustainably. Demand grows due to companies' increasing commitments to sustainability and rising regulatory pressures to achieve carbon neutrality. Compared to other segments, including Avoidance / Reduction Projects, this segment shows a faster growth rate, driven by the higher willingness of buyers to invest in long-term, sustainable solutions. Its appeal lies in the dual benefits of environmental restoration and carbon offsetting, making it a preferred choice for environmentally conscious buyers in sectors including energy and manufacturing.
Technology-based Removal / Sequestration segment is expected to reach USD 1,360 billion by 2033. This segment primarily involves innovative technologies that capture and store carbon dioxide emissions from various industrial processes, appealing to companies aiming to meet stringent environmental targets. Cement plant CO₂ capture and CCUS integration illustrates how these technologies apply to heavy industry. The increasing emphasis on advanced carbon capture solutions drives investments in this segment, attracting companies across energy, manufacturing, and technology sectors. Unlike other project types, this segment exhibits a slower growth rate, with a CAGR of 27.6% compared to the 44% anticipated in the Voluntary segment. Factors influencing adoption include the high costs associated with technology development and regulatory pressures favoring sustainable practices. Technology-based solutions give firms a pathway to strengthen their sustainability strategies and address climate change directly, shifting market dynamics toward more innovative carbon management approaches.
Power is valued at USD 840.2 billion in 2026 and is projected to reach USD 4,391.9 billion by 2033, at a CAGR of 26.7% during the forecast period. This segment primarily supports electricity generation and distribution, used by energy companies and utilities aiming to offset their greenhouse gas emissions. A significant driver for this segment involves tightening regulations around emissions, compelling these entities to invest in carbon credits to meet compliance targets. Compared to other segments, including Transportation or Aviation, the Power segment experiences slower growth, yet maintains a crucial role in the broader carbon credit ecosystem due to the scale of carbon emissions from power generation. The demand for cleaner energy sources and the transition toward renewable technologies further influence purchasing behaviors, reinforcing the importance of carbon credits in achieving sustainability goals.
Energy Supply segment is estimated to reach USD 2,522.8 billion by 2033, at a CAGR of 28.9% during the forecast period. This segment primarily serves energy companies and utilities, focusing on carbon credits to offset emissions associated with energy production. A prominent driver for this segment stems from the push for renewable energy sources, which enhances demand for carbon credits among energy suppliers aiming for sustainability goals. Compared to other segments, Energy Supply exhibits a higher growth rate, reflecting an increasing reliance on cleaner energy alternatives and environmental regulations targeting emissions reduction. The anticipated transition toward greener energy solutions is expected to stimulate investments in carbon credits, distinguishing this segment from more traditional sectors within the market.
Aviation segment is expected to reach USD 1,994.1 billion by 2033. This segment primarily serves airlines and aviation companies focusing on reducing their carbon footprint through purchasing carbon credits. A critical force influencing this market involves increasing regulatory pressures aimed at lowering emissions from air travel. Airlines actively seek to comply with these regulations while enhancing their sustainability profiles. Sustainable aviation fuel is one related route to lowering emissions from air travel. The aviation segment experiences rapid growth compared to others, driven by a CAGR of 27.1% during the forecast period. This growth stems from airlines implementing strategies to offset emissions, leading to a higher demand for carbon credits specifically tailored for aviation needs. Unlike other end-use categories, aviation faces unique challenges related to technology adoption and pricing, impacting how companies approach carbon credit procurement in the market.
Transportation is projected to grow at a CAGR of 27.1% during the forecast period. This segment encompasses carbon credits for reducing emissions related to transportation activities, including freight, logistics, and passenger services. Companies in the transportation sector, including airlines and shipping firms, actively seek credits to offset their carbon footprint and comply with regulatory requirements. Maritime decarbonization is a related area of activity for shipping firms. Increased emphasis on sustainable practices drives demand, with many organizations aiming to enhance their environmental image. Regulatory pressures and growing consumer awareness regarding climate change contribute significantly to this growth. Compared to other sub-segments, the transportation segment experiences a unique combination of regulatory and market dynamics, positioning it for robust development in the coming years while addressing the specific challenges associated with emission reductions in this sector.
Buildings serve multiple purposes within various sectors, focusing on compliance with environmental standards and sustainability initiatives. This segment attracts interest from construction and real estate companies striving to meet regulatory requirements and enhance their sustainability profiles. Rising awareness around energy efficiency and carbon footprint reduction influences purchasing behavior significantly. Energy retrofit projects are one way property owners reduce emissions in existing buildings. Regulatory pressures frequently drive demand for carbon credits in this segment, particularly in markets emphasizing energy-efficient building practices. Compared to other end-use segments, the Buildings segment faces unique considerations regarding technology adoption and cost management, influencing its growth trajectory. This segment typically involves longer payback periods and higher initial investments than others, impacting decision-making among buyers. The increasing incorporation of sustainable materials and designs is expected to encourage further engagement in the market.
Industrial applications represent a critical component of the carbon credit framework, focusing on emissions reductions across manufacturing and production sectors. Industries including steel, cement, and chemicals engage in carbon credit purchasing to comply with regulatory requirements and demonstrate environmental responsibility. Increased regulatory pressure for emissions reduction drives demand within this segment, compelling companies to invest in carbon credits to meet their sustainability goals. This segment experiences different growth dynamics compared to others, influenced by the regulatory landscape and the specific emissions profiles of industrial operations. Unlike the voluntary segment, which absorbs fluctuating market trends, the industrial segment faces consistent demand driven by compliance obligations. This distinct nature highlights the importance of regulatory frameworks in shaping purchasing decisions and overall market behavior.
The Others (Agriculture, Forestry, Waste) segment encompasses a diverse range of carbon credit applications aimed at reducing emissions and enhancing carbon sequestration through various projects. Sectors including agriculture apply these credits to promote sustainable practices, while forestry initiatives focus on reforestation and land management strategies. The primary driver of this segment stems from increasing regulatory pressures and corporate commitments to sustainability, which compel organizations to engage in carbon offsetting efforts. Compared to other segments, the Others category experiences slower growth due to the complexity and variability in project implementation across different regions. While projects vary significantly, they frequently face challenges with verification and validation processes, impacting their market appeal. This segment serves buyers that prioritize environmental stewardship and are willing to invest in long-term solutions that contribute to their overall sustainability goals within the market.
Spot / Physical segment is valued at USD 1,659.4 billion in 2026 and is projected to reach USD 7,889.1 billion by 2033, at a CAGR of 24.9% during the forecast period. This segment primarily serves buyers seeking immediate transactions of carbon credits to meet regulatory requirements or voluntary sustainability goals. Demand is driven by increasing regulatory pressures and a heightened focus on corporate responsibility towards emissions reduction. Compared to other delivery types, Spot / Physical transactions offer immediate access to credits, catering to companies that prioritize quick compliance. In contrast, Futures & Forwards transactions, projected to reach USD 7,172.2 billion by 2033 with a CAGR of 31.4%, appeal to entities looking for price hedging strategies or longer-term planning. The distinct needs across these segments highlight the dynamic nature of the market, responding to evolving regulatory environments and corporate sustainability commitments.
This segment primarily serves entities looking to hedge against price fluctuations in carbon credits, providing a mechanism for securing future transactions at predetermined prices. These contracts are a type of derivative, a category that includes exchange-traded and OTC derivatives. Businesses, especially in energy-intensive industries, use these instruments to manage compliance costs while ensuring market stability. Demand in this segment is driven by increasing regulatory frameworks and corporate sustainability initiatives. Unlike other segments, including Compliance, which grows at a CAGR of 27.3%, the Futures & Forwards segment experiences higher growth, indicating a robust appetite for financial instruments that offer flexibility and risk management in the evolving carbon credit market.
Based on geography, the Global Carbon Credit market is divided into North America, Europe, Asia-Pacific, South America, Middle East, and Africa.
Significant growth is anticipated in the Carbon Credit market within North America, driven by a strong focus on environmental sustainability and regulatory frameworks. The United States, Canada, and Mexico exhibit increasing demand for compliance credits, reflecting heightened corporate responsibility toward emission reductions. The region's commitment to achieving net-zero targets enhances investment in carbon offset initiatives, particularly in industries including energy and transportation. North America is projected to reach USD 1,948.9 billion by the end of 2033. This growth trajectory aligns with a share of 5.6% of the global market in 2025, highlighting the region's evolving landscape for carbon credit transactions. Organizations are expected to enhance their participation in both compliance and voluntary markets, thus contributing to the overall expansion of the market.
Europe represents a significant player in the Carbon Credit market, accounting for 86.7% of the global share in 2025. Key drivers of demand include stringent environmental regulations and a strong emphasis on sustainability initiatives across various sectors, particularly in Germany, France, the UK, Italy, and Spain. The regulatory environment in Europe supports numerous projects aimed at emissions reduction and carbon offsetting, driving growth in compliance markets. Countries within the region are investing heavily in both nature-based and technology-based removal projects, enhancing the market's appeal to environmentally conscious investors. This focus on compliance and innovative carbon solutions positions Europe as a leader in the carbon credit framework, influencing trends and shaping demand dynamics within the broader market.
Asia-Pacific stands out within the Carbon Credit market due to its rapidly expanding industries, particularly in manufacturing and energy. Countries including China and India exhibit increasing emissions, resulting in heightened demand for compliance solutions. Infrastructure development projects, especially in renewable energy, serve as significant drivers for carbon credit adoption. Economic growth across Southeast Asia further increases investment in sustainability initiatives aimed at mitigating environmental impact. The region accounted for 5.0% of the global market share in 2025, with substantial potential for growth through innovative carbon reduction technologies. This evolving landscape signals a shift toward greater corporate responsibility and regulatory alignment in the Carbon Credit market.
Demand within the Carbon Credit market in South America is primarily driven by the energy sector, with Brazil and Argentina emerging as key contributors. The region accounts for 1.6% of the global market share in 2025. Infrastructure investments focused on renewable energy solutions support the expansion of carbon credit initiatives, enhancing compliance with international sustainability standards. Regulatory frameworks in these countries emphasize the significance of emissions reductions, encouraging local industries to engage in carbon trading. This regulatory commitment, alongside growing corporate sustainability pledges, creates a favorable environment for the market's growth. Challenges include limited awareness and adoption among smaller businesses, which restrict overall market penetration within the region.
The Middle East and Africa region contributes 1.1% of the global market share in 2025. In this region, the demand for carbon credits primarily comes from industries focusing on sustainability and emissions reductions, particularly in Saudi Arabia and the UAE, driven by initiatives aimed at diversifying their economies. South Africa demonstrates increasing interest in carbon credit projects, particularly in renewable energy and natural resource management. Infrastructure development in the region supports growth, with a rising emphasis on integrating carbon credit systems into national climate strategies. The market benefits from regional collaborations that enhance investment opportunities and technology transfer. Evolving regulatory frameworks encourage participation from various sectors.
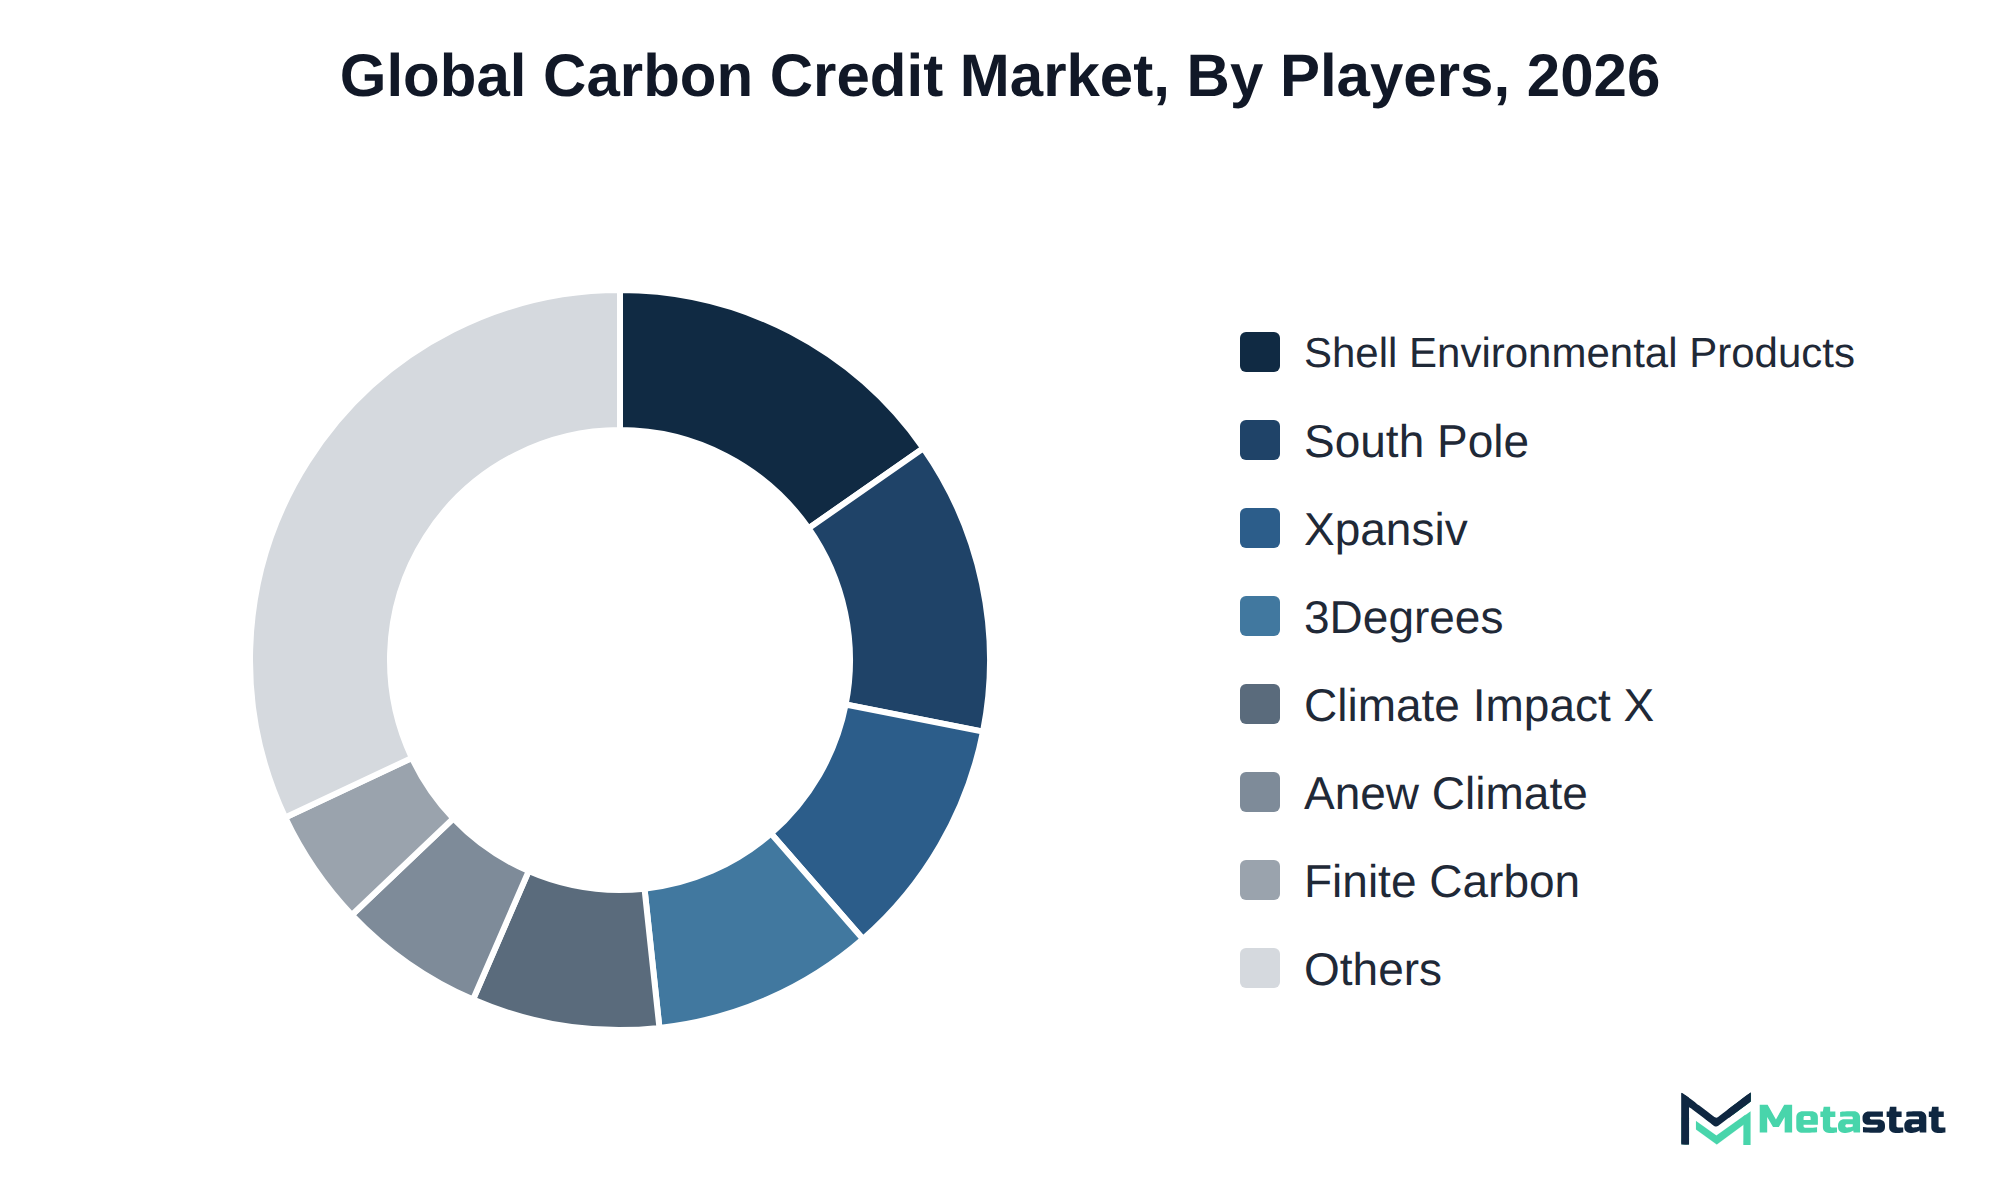
Competition within the Carbon Credit market features a mix of compliance and voluntary players, each focusing on unique aspects of carbon credit offerings. Companies like South Pole and Anew Climate emphasize compliance solutions while others, including Carbonfuture and Patch, specialize in voluntary credits. This division allows buyers to select services that align with their sustainability goals, regulatory requirements, and corporate strategies.
Buyers evaluate options based on multiple factors including price, certification standards, and customization capabilities. For instance, Climate Impact X focuses on offering certified carbon credits, which appeal to enterprises prioritizing regulatory compliance. In contrast, firms like Climeworks provide innovative technology-based solutions that attract customers seeking advanced carbon removal methods. These competitive strategies shape the market by catering to the diverse needs of buyers.
Achieving growth in the Carbon Credit market relies on several key developments. A significant increase in compliance-driven projects will support market expansion, with revenues rising from USD 2,671.3 billion in 2026 to USD 14,440.8 billion by 2033. This growth is driven by regulations that enhance corporate accountability and sustainability initiatives, particularly in Europe, where demand shows strong momentum. The rise of voluntary carbon credits will augment market dynamics, with a projected value of USD 620.5 billion by 2033. The energy supply sector will play a critical role, with its market share expected to reach USD 2,522.8 billion, reflecting a 28.9% CAGR. However, potential risks including regulatory uncertainty and market volatility hinder growth. Setbacks in policy implementation or shifts in climate strategies could slow down the adoption of carbon credit mechanisms, reducing overall market efficiency. The trajectory towards the projected USD 15,061.4 billion remains contingent on these developments and risks.
By Market Type: Compliance, Voluntary
By Project Type: Avoidance / Reduction Projects, Nature-based Removal / Sequestration, Technology-based Removal / Sequestration
By End Use: Power, Energy Supply, Aviation, Transportation, Buildings, Industrial, Others (Agriculture, Forestry, Waste)
By Delivery Type: Spot / Physical, Futures & Forwards
The report strategically identifies and profiles the key market players and analyses their core competencies in each sub-segment of the Carbon Credit market.
|
Report Attributes |
Details |
|
Study Period |
2021-2033 |
|
Base Year |
2025 |
|
Estimated Year |
2026 |
|
Forecast Period |
2026-2033 |
|
Historical Period |
2021-2025 |
|
Growth Rate |
CAGR 27.7% from 2026 to 2033 |
|
Revenue Unit |
USD billion |
|
Segmentation |
By Market Type, Project Type, End Use, Delivery Type, and Region |
|
By Region |
North America (By Market Type, Project Type, End Use, Delivery Type, and Country)
|
|
Europe (By Market Type, Project Type, End Use, Delivery Type, and Country)
|
|
|
Asia Pacific (By Market Type, Project Type, End Use, Delivery Type, and Country)
|
|
|
South America (By Market Type, Project Type, End Use, Delivery Type, and Country)
|
|
|
Middle East and Africa (By Market Type, Project Type, End Use, Delivery Type, and Country)
|
Find answers to common questions about this report
The Carbon Credit market size was valued at USD 2,124.3 billion in 2025.
The market is projected to grow at a CAGR of 27.7% during the forecast period from 2026 to 2033.
The North America Carbon Credit market size is estimated to reach USD 1,948.9 billion by 2033.
The Compliance segment leads the Carbon Credit market, with a projected value of USD 14,440.8 billion by 2033. This segment demonstrates a compound annual growth rate of 27.3 percent from 2026 to 2033.
A significant rise in corporate sustainability initiatives drives increased purchases of carbon credits across various industries. The voluntary carbon credit segment experiences rapid growth due to increasing interest in sustainability practices among companies.
Europe holds the dominant share of the Carbon Credit market, accounting for 86.7% of the total market in 2025. This significant share reflects Europe's strong regulatory framework and commitment to carbon reduction initiatives.
Rising compliance costs associated with carbon credit regulations and the increasing complexity of regulatory frameworks limit market growth. Smaller enterprises face affordability concerns due to higher prices, leading to slower uptake and smaller orders.
A significant rise in corporate sustainability initiatives drives increased demand for carbon credits, with organizations prioritizing carbon neutrality targets. The emphasis on transparency and quality in project selection enhances buyer confidence, promoting broader adoption across various sectors.
The Carbon Credit market is estimated to reach a valuation of USD 15,061.4 billion by 2033.
Key players operating in the Carbon Credit market include South Pole, Anew Climate, Xpansiv, Climate Impact X, Shell Environmental Products, and Climeworks.
The analysts below cover Energy and Power research at Metastat Insights.
LEAD ANALYST
Utkarsh Khirodkar is a Lead Market Research Analyst at MetaStat Insight, specializing in market intelligence, technology sector assessments, and competitive strategy.

PRINCIPAL CONSULTANT - ENTERPRISE AI & EMERGING TECHNOLOGIES
Banking & Finance · Electronics and Semiconductor · Energy and Power · Healthcare IT · Information & Technology · Professional Services
Vijay Gunti is a Principal Consultant at MetaStat Insight, bringing over two decades of experience across enterprise digital transformation, technology strategy, and intelligent systems.

ENERGY & INFRASTRUCTURE INDUSTRY CONSULTANT
Automotive and Transportation · Electronics and Semiconductor · Energy and Power · Machinery & Equipment
Saurabh Vasant Ganvir consults for Energy & Infrastructure Industry at MetaStat Insight, specializing in renewable energy, solar EPC, and electric vehicle (EV) infrastructure markets.
The technical breakdown of ISO 20022 migration readiness across correspondent banking corridors was remarkably thorough. Rather than treating cross-border corporate payments as a single block, the report drew a useful distinction between multilateral netting platforms and domestic instant payment rails across ASEAN economies. MetaStat Insight highlighted regulatory constraints on foreign exchange liquidity management that many publications gloss over. The research material offered practical clarity for our platform development roadmap.
Our group needed clearer visibility into out-of-autoclave processing timelines for high-temperature thermoplastic composites. MetaStat Insight delivered an objective assessment that contrasted automated fiber placement scrap rates with traditional thermoset prepreg layup cycles. The supplier landscape mapped out primary resin suppliers and tape slitting capacity across France, Germany, and Japan with solid technical accuracy. Their analyst handled our questions on precursor supply risks during an unscheduled inquiry call, providing clear, unembellished context.
Evaluating sensor fusion reliability across harsh operating environments can be tricky without field-validated data. The study on agricultural autonomous guidance systems clearly separated stereo vision setups from automotive-grade solid-state LiDAR. We appreciated the regional infrastructure analysis, specifically around RTK network density across North America and South America. During our follow-up consultation, the MetaStat Insight team walked through tier-two perception software partnerships, giving our engineering leads a practical basis for vendor shortlisting.
Explore related market intelligence reports worth reading alongside this one.